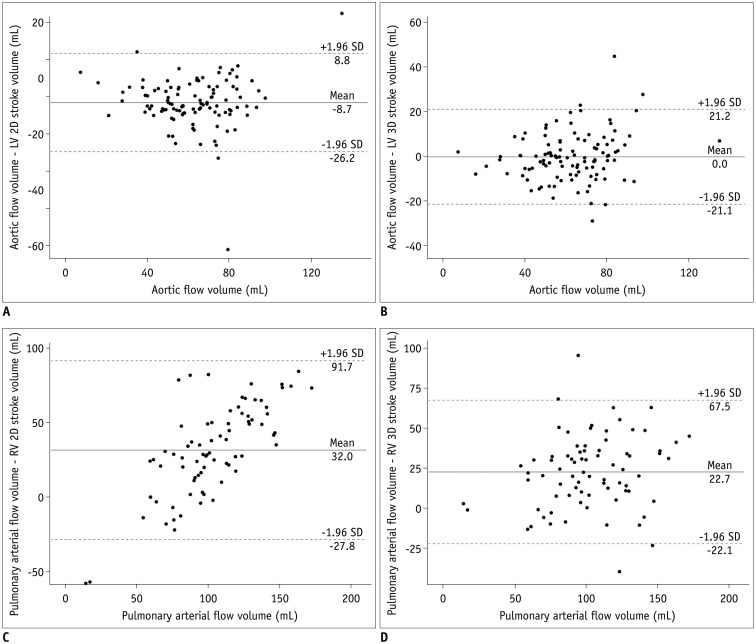
Fig. 4. Bland-Altman plots illustrating mean differences and 95% limits of agreement between arterial flow volumes measured by phase-contrast MRI and stroke volumes calculated from ventricular volumes, with arterial flow volumes as gold standard.
A. Bland-Altman plot between aortic flow volumes and LV stroke volume from 2D short-axis cine MRI. B. Bland-Altman plot between aortic flow volumes and LV stroke volume from 3D whole-heart MRI. C. Bland-Altman plot between pulmonary arterial flow volumes and RV stroke volume from 2D short-axis cine MRI. D. Bland-Altman plot between pulmonary arterial flow volumes and RV stroke volume from 3D whole-heart MRI. SD = standard deviation

