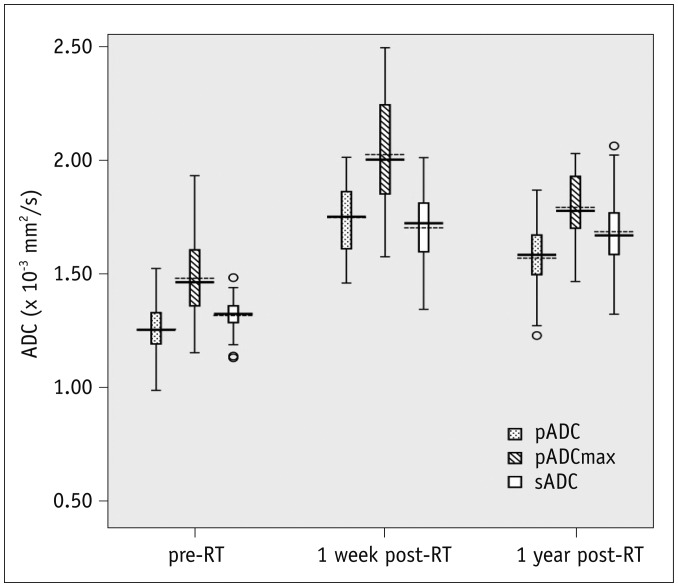
Fig. 2. Box plots show different ADC levels of salivary glands in all patients before and after RT.
Mean and median are given by dotted and solid lines, respectively (dotted lines, means; solid lines, medians; boundaries of boxes, 25%/75% quintiles; error bars, 10%/90% quintiles; data points, outliers). Graph shows that ADC values of salivary glands increase after RT (p < 0.001). Compared with 1 week post-RT, pADC and pADCmax both decreased at 1 year post-RT (p < 0.001), but sADC shows no significant change (p = 0.581). ADC = apparent diffusion coefficient, pADC = ADC of parotid glands at rest, pADCmax = maximum ADC of parotid glands, sADC = ADC of submandibular glands at rest

