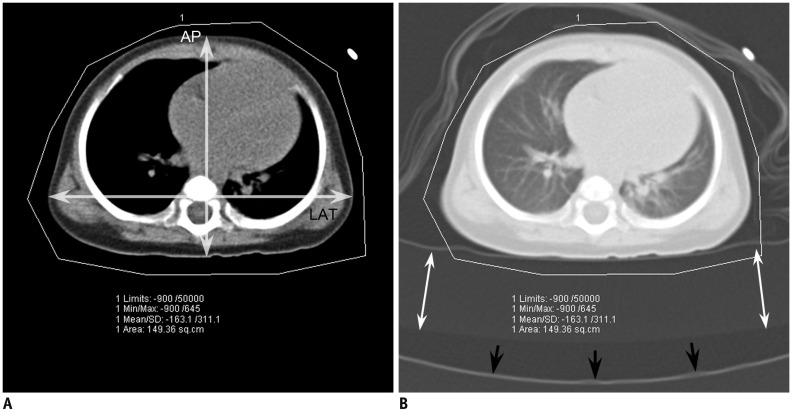
Fig. 1. Axial CT image obtained approximately 1–2 cm above dome of liver in which X-ray output in CTDIvol based on 32-cm phantom was individually determined.
To measure area and mean density, CT technologist draws region of interest to include entire patient cross-section with upper (50000 HU) and lower (−900 HU) limits of CT numbers.
A. On same axial CT image with mediastinal window setting, AP was measured from most anterior body surface to most posterior body surface (vertical arrow) and LAT was measured from most right lateral body surface to most left lateral body surface (horizontal arrow). B. On same axial CT image with lung window setting, additional radiolucent pad (white arrow) is shown to be placed on CT table (black arrows) to adjust patient's vertical position at isocenter. Blanket wrapping around patient and patient cloth are shown in lung window. AP = anteroposterior diameter, CT = computed tomography, CTDIvol = volume CT dose index, HU = Hounsfield units, LAT = lateral diameter

