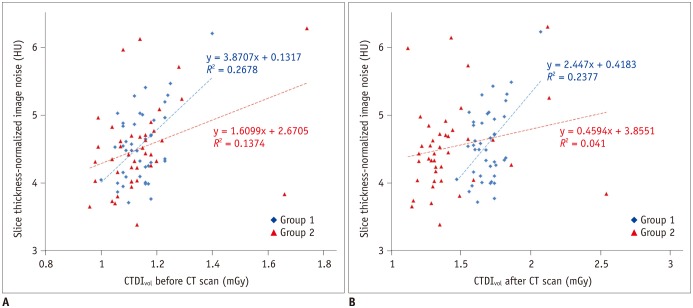
Fig. 5. Scatter plots demonstrating correlations between radiation dose and image noise of cardiothoracic CT.
A. In scatter plot, group 1 illustrates higher correlation (r = 0.52; p = 0.0004) between CTDIvol before CT scan and slice thickness-normalized image noise than that (r = 0.37; p = 0.02) in group 2. B. In scatter plot, group 1 illustrates modest correlation (r = 0.49; p = 0.001) between CTDIvol after CT scan and slice thickness-normalized image noise. In contrast, group 2 shows no significant correlation (r = 0.20; p = 0.2) between them that may be attributed to reduction of CTDIvol after CT scan, graphically recognized as leftward shift of red triangular points of group 2 in X-axis, compared with blue rhomboid points of group 1.

