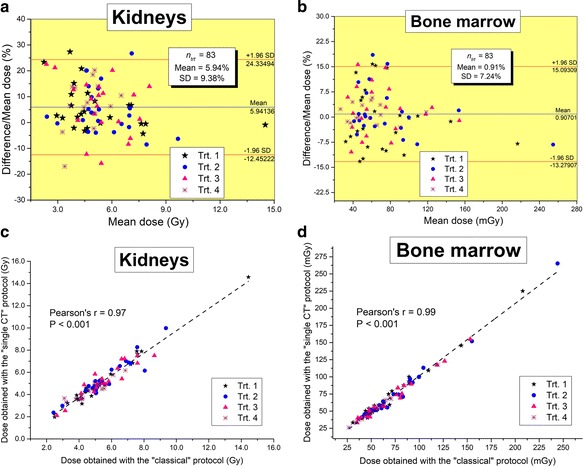
Fig. 4.

Bland and Altman plots showing differences in the absorbed doses to the kidneys (a) and bone marrow (b) after PRRT cycles 1 to 4, computed using the “classical” protocol and the “single CT” protocol, are presented with the 95% limits of agreement (mean ± 1.96 SD). Correlation plots for the doses obtained with the “single CT” protocol against the “classical” one are also shown for the kidneys in c and bone marrow d
