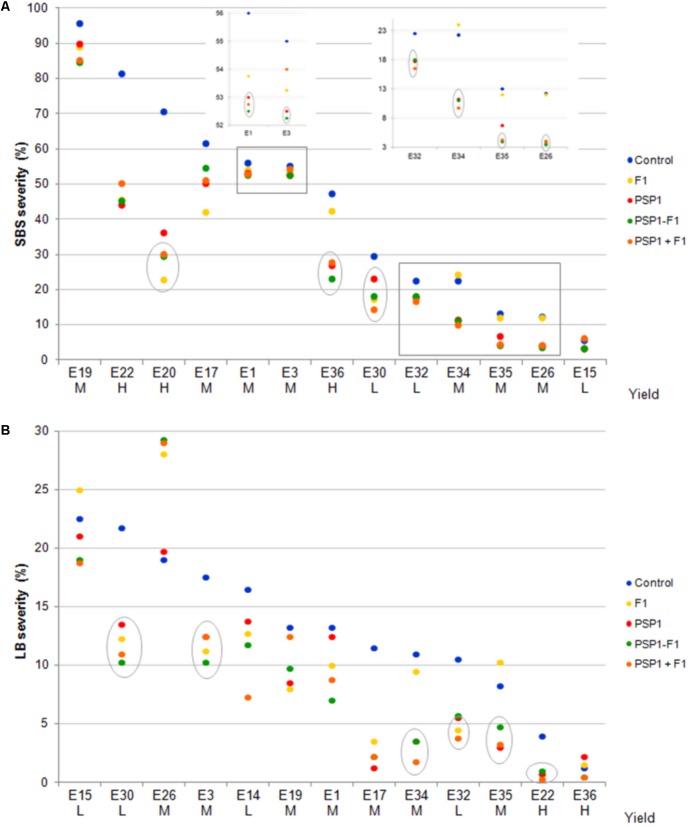
FIGURE 5.
Soybean field trials at 14 different locations in the central region of Argentina during growing season 2014-15. Severities (%) of SBS (S. glycines) and LB (C. kikuchii) assessed 40 days after R3 application are shown in (A,B), respectively. Trials (named E) are ranked according to decreasing severity values in the control treatment for each disease and classified according grain yield in low (L), medium M and high yield (H). Treatments were control (standard soybean crop management without foliar fungicide or biocontrol treatment), F1 (fungicide F1 alone at R3), PSP1 (PSP1 alone at V6), PSP1-F1 (PSP1 at V6 plus fungicide F1 at R3 one at the time) and PSP1+F1 (PSP1 plus fungicide F1 at R3 at the same time). Symbols in gray circles indicate treatments significant different to the correspondent control treatment (according to Dunnet test; p < 0.05) and gray boxes are enlarged on the inserted graphics for better view. SBS or LB severity were not evaluated for E14 and E20, respectively. L, low yield; M, medium yield; H, high yield.

