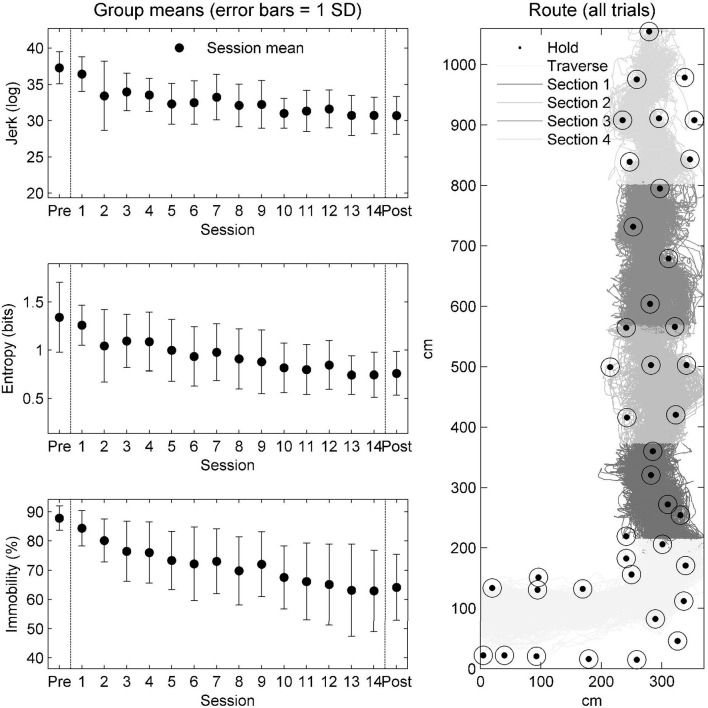
Figure 7.
Grouped outcomes through practice. The graphs on the left show the session average and standard deviations of jerk (top), entropy (middle), and immobility (bottom) for the seven climbers followed through practice. The graph on the right indicates the design characteristics of the route. Dotted circles indicate the position of the holds. The hip position of all trials of practice across all participants onto the wall plane. The different shades of the hip data are a function of the section of the route (see the legend).

