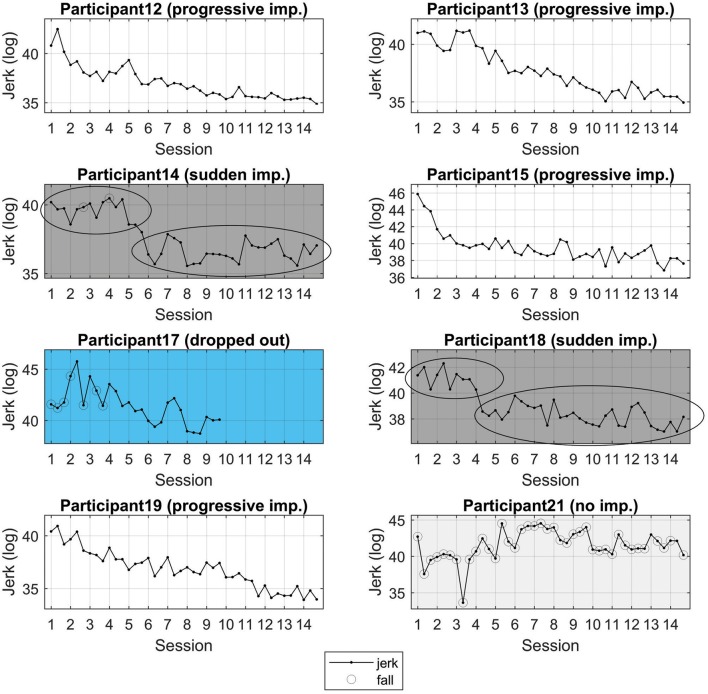
Figure 8.
Individual learning curves. Three types of learning curves are apparent. Continuous improvement (participants 12, 13, 15, and 19); sudden improvement (participants 14 and 18), and; no improvement (participants 21). imp. = improvement. Note that here different scales are used in the y-axis in order to accentuate the nature of the learning curve for each individual. Different color schemes are used to highlight subgroupings.

