Figure 3.

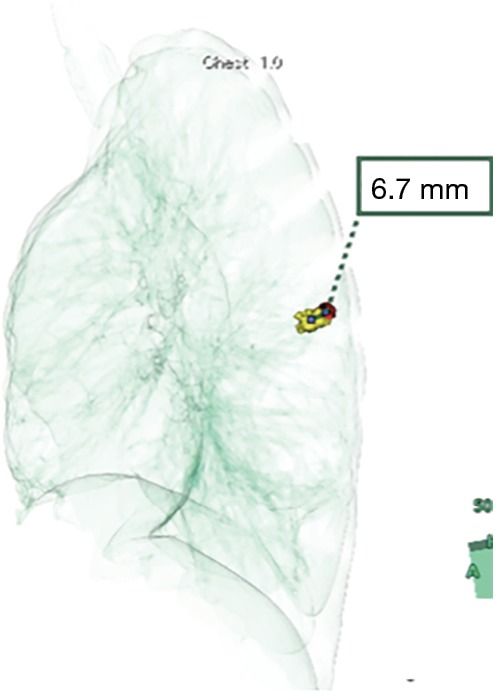
The target lesion (red) and radio-opaque nodule (yellow) with accumulated lipiodol. The deviation was measured as the distance between the centers of the target lesion and nodule on the 3D CT image. CT, computed tomography.

The target lesion (red) and radio-opaque nodule (yellow) with accumulated lipiodol. The deviation was measured as the distance between the centers of the target lesion and nodule on the 3D CT image. CT, computed tomography.