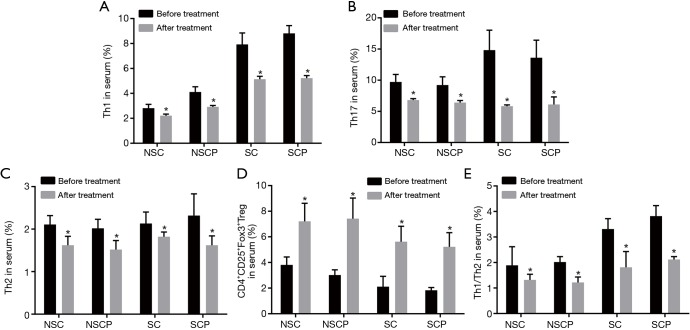
Figure 4.
Levels of Th1, Th2, Th17, Th1/Th2 and CD4+CD25+Fox3+Tregs in the NS-COPD, NS-control, S-COPD and S-control groups before and after treatment. (A) Changes of the content of Th1 cells in blood before and after treatment; (B) changes of the content of Th17 cells in blood before and after treatment; (C) changes of the content of Th2 cells in blood before and after treatment; (D) changes of the content of CD4+CD25+Fox3+Tregs cells in blood before and after treatment; (E) changes of the content of Th1/Th2 cells in blood before and after treatment. *, P<0.05 vs. T cells before treatment; number of samples: NSC =114, NSCP =116, SC =110, SCP =118. NS-COPD, non-smoking COPD; NS-control, non-smoking control; S-COPD, smoking COPD; S-control, smoking control; COPD, chronic obstructive pulmonary disease; Tregs, regulatory T cells; Th, helper T cells.

