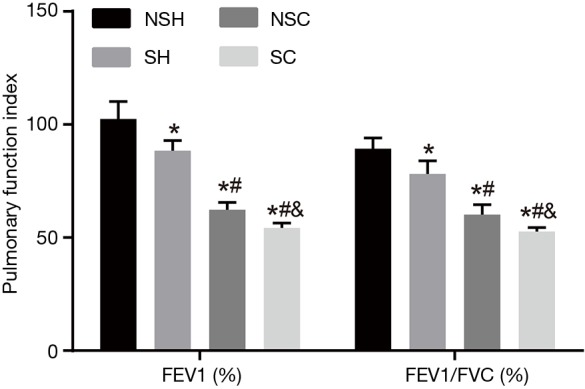
Figure 5.

FEV1 (%) and FEV1/FVC (%) in the NSH, SH, NS-COPD and S-COPD groups before treatment. *, P<0.05 vs. the NSH group; #, P<0.05 vs. the SH group; &, P<0.05 vs. the NS-COPD group; number of samples: NSH =121, SH =124, NSC =114, SC =110. NS-COPD, non-smoking COPD; S-COPD, smoking COPD; NSH, non-smoking healthy people; SH, smoking healthy people; COPD, chronic obstructive pulmonary disease; FEV1, forced expiratory volume in one second; FVC, forced vital capacity.
