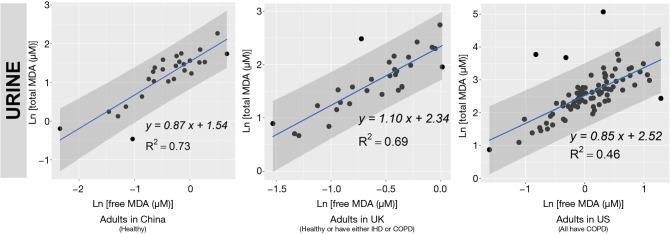
Figure 2.
Scatterplots and simple linear regressions (blue lines) of total malondialdehyde (MDA) against free MDA in urine samples from three studies. When multiple samples were from an individual, the average concentration was calculated for the person. Concentrations were natural-log transformed for all analyses. The blue lines indicated the line of simple linear regression. The gray zone indicated the 95% confidence interval. COPD, chronic obstructive pulmonary disease; EBC, exhaled breath condensate; IHD, ischemic heart disease; MDA, malondialdehyde.

