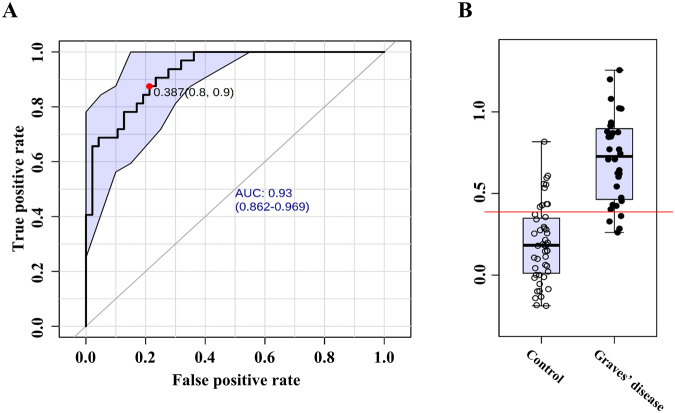
Figure 2.
(A) Receiver operating characteristic (ROC) analysis of multiple metabolite panels for discriminating the healthy control and Graves’ disease group. Score matrix (t[1]) is computed based on relative concentration of 10 metabolites by OPLS-DA and the single numerical variable is introduced for ROC analysis. The 10 metabolites are glucose, pelargonic acid, 2-(4-hydroxyphenyl)ethanol, gluconic acid lactone, glycerol, pentadecanoic acid, mannose, threose, fumaric acid, and pyruvic acid. The value of the area under curve (AUC) is 0.93 (95% confidence interval: 0.862–0.969). Optimal cutoff is determined using the closest to top-left corner and the 95% confidence interval is calculated using 500 bootstrappings. (B) Box-and-whisker plot present the relative abundances of the variable (t[1] component) of healthy control (left) and GD (right).

