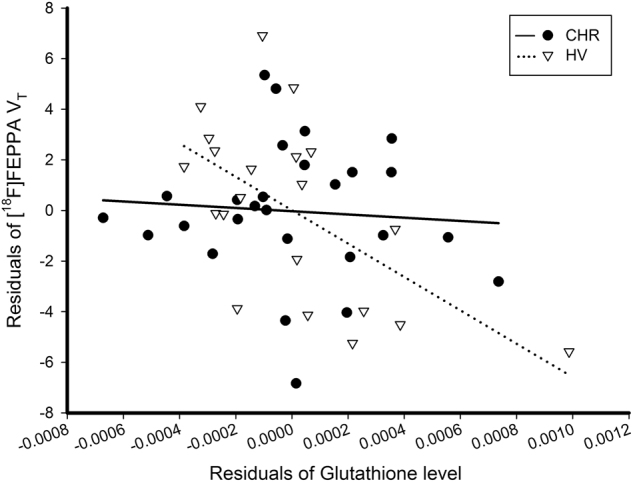
Fig. 3.

Association between [18F]FEPPA VT and glutathione levels in mPFC (controlling for TSPO genotype). The graph presents the significant interaction between group × glutathione levels on [18F]FEPPA VT (F(4, 43) = 10.01, p < 0.001; t = −2.10, p = 0.04). The significant correlation in healthy volunteers remains after excluding healthy volunteer with the highest glutathione value (r = −0.51, p = 0.025)
