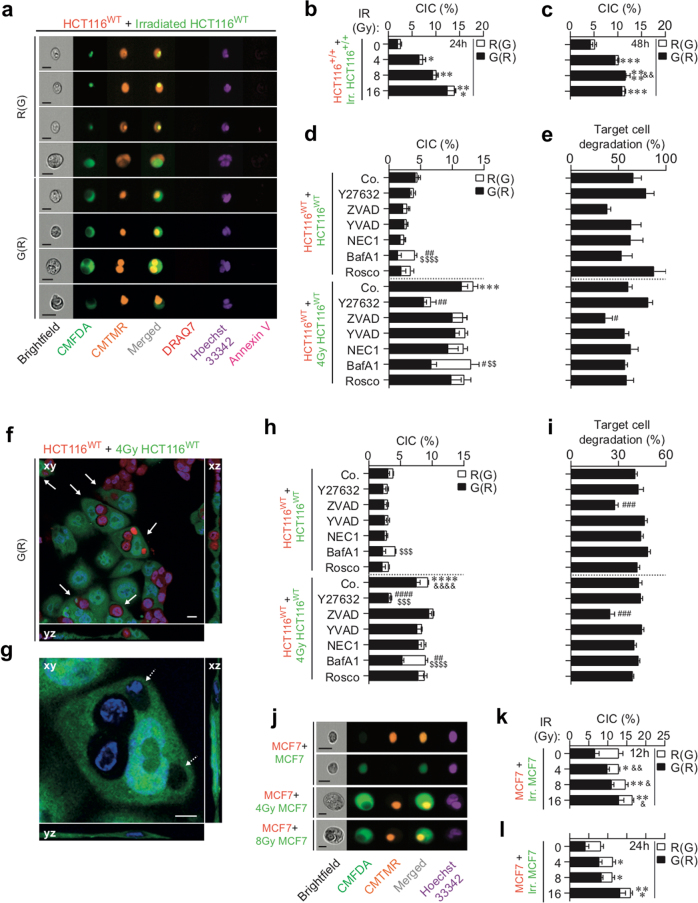
Fig. 5. Detection of γ-irradiation–elicited NCAD modalities by quantitative imaging flow cytometry and confocal fluorescence microscopy.
a–l Simultaneously to the detection of CAD mechanisms in Fig. 2, cell-in-cell structures and target cell degradation were determined by quantitative imaging (a–e and j–l) and confocal fluorescent microscopy (f–i) after 24-h (a, b, d–i, l), 48-h (c), or 12-h (j, k) co-culture of untreated (red) CMTMR-labeled HCT116WT cells (a, d–i), HCT116+/+ cells (b, c), or MCF7 cells (j–l) with, respectively, (green) CMFDA-labeled HCT116WT cells (a, d–i), HCT116+/+ cells (b, c), or MCF7 cells (j–l) that have been irradiated or not with 4 Gy of γ-ionizing radiation. Then (red) CMTMR-labeled HCT116 cells internalizing (green) CMFDA-labeled HCT116 cells (noted R(G)), and (green) CMFDA-labeled HCT116 cells internalizing (red) CMTMR-labeled HCT116 cells (noted G(R)) were detected and quantified. Representative images of quantitative imaging are shown in (a, j) (scale, 20 μm). Representative images (a, f, g, j) and frequencies of cell-in-cell (CIC) structures (b–d, h, k, l) and target cell degradation (e, i) were obtained and quantified by quantitative imaging flow cytometry (a–e and j–l) and confocal microscopy (f–i). White arrows indicate CIC structures and white dotted arrows target cell degradation as observed by confocal microscopy (f, g) (scale bar = 10 μm). Frequencies of CIC structures showing R(G), and G(R) (h) and target cell degradation (i) have been determined (means ± SEM, n = 3). For b, c, asterisk (*) is used for the comparison of “HCT116+/++Irr.HCT116+/+” with “HCT116+/++0 Gy HCT116+/+” for G(R), and ampersand (&) is used for the comparison of “HCT116+/++Irr. HCT116+/+” with “HCT116+/++0 Gy HCT116+/+” cells for R(G). For d, h, asterisk (*) is used for the comparison of “HCT116WT+4 Gy control (Co.) HCT116WT” with “HCT116WT+control (Co.) HCT116WT” for G(R), ampersand (&) for comparison of “HCT116WT+4 Gy control (Co.) HCT116WT” cells with “HCT116WT+control (Co.) HCT116WT” for R(G), hash (#) for the comparison of inhibitor-treated cells with control cells for G(R), and dollar symbol ($) for the comparison of inhibitor-treated cells with respective control cells for R(G). For e, i, hash (#) is used for the comparison of inhibitor-treated cells with respective control cells for target cell degradation. For k, l, asterisk (*) is used for the comparison of “MCF7+Irr. MCF7” with “MCF7+0 Gy MCF7” for G(R) and ampersand (&) is used for the comparison of “MCF7+Irr. MCF7” with “MCF7+0 Gy MCF7” for R(G). *, #, &p < 0.05; **, ##, &&p < 0.01; ***, ###, $$$p < 0.001; and ****, ####, $$$$, &&&&p < 0.0001

