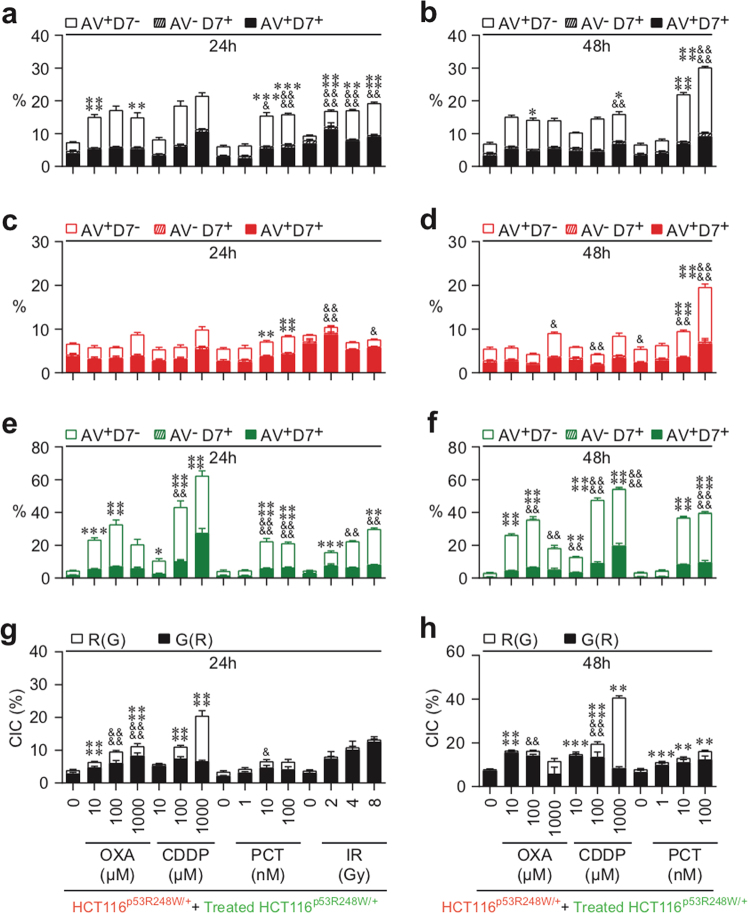
Fig. 8. CAD and NCAD modalities elicited by chemotherapies and radiotherapy are distinctly regulated by p53 transcriptional activity.
Quantitative imaging flow-cytometric detection of CAD and NCAD modalities was performed after 24 h (a, c, e, g) and 48 h (b, d, f, h) co-cultures of untreated (red) CMTMR-labeled HCT116 p53R248W/+ cells with untreated (green) CMFDA-labeled HCT116 p53R248W/+ cells, or with OXA-, CDDP-, PCT- or IR-treated (green) CMFDA-labeled HCT116 p53R248W/+ cells. Concentrations of OXA, CDDP, or PCT or doses of γ-irradiation used are indicated. The frequencies of AV+D7− cells, AV−D7+ cells, and AV+D7+ cells were determined as previously described on total cell population (as revealed by CMTMR+ or CMFDA+ HCT116 p53R248W/+ cells (a, b)), on untreated (red) CMTMR+ HCT116 p53R248W/+ cells (c, d), on untreated (green) CMFDA+ HCT116 cells (e, f), and on treated (green) CMFDA+ HCT116 p53R248W/+ (e, f). Means ± SEM are indicated (n = 3). For a–f, asterisk (*) is used for the comparison of “HCT116 p53R248W/++OXA- or CDDP- or PCT- or IR-treated HCT116 p53R248W/+” with “HCT116+/++OXA- or CDDP- or PCT- or IR-treated HCT116+/+” (from Figs. 2c–e, 3a–f, and 4a-c) for AV+D7−, and ampersand (&) is used for the comparison of “HCT116R248W/++OXA- or CDDP- or PCT- or IR-treated HCT116 p53R248W/+” with “HCT116+/++OXA- or CDDP- or PCT- or IR-treated HCT116+/+” (from Figs. 2c–e, 3a–f, and 4a–c) for D7+. For Fig. 7g, h, asterisk (*) is used for the comparison of “HCT116 p53R248W/++OXA- or CDDP- or PCT- or IR-treated HCT116 p53R248W/+” with “HCT116+/++OXA-or CDDP- or PCT- or IR-treated HCT116+/+” (from Fig. 5b, c) for G(R), and ampersand (&) is used for comparison of “HCT116 p53R248W/++OXA- or CDDP- or PCT- or IR-treated HCT116 p53R248W/+” with “HCT116+/++OXA- or CDDP- or PCT- or IR-treated HCT116+/+” (from Fig. 5b, c) for R(G). *, &p < 0.05; **, &&p < 0.01; ***p < 0.001; and ****, &&&&p < 0.0001

