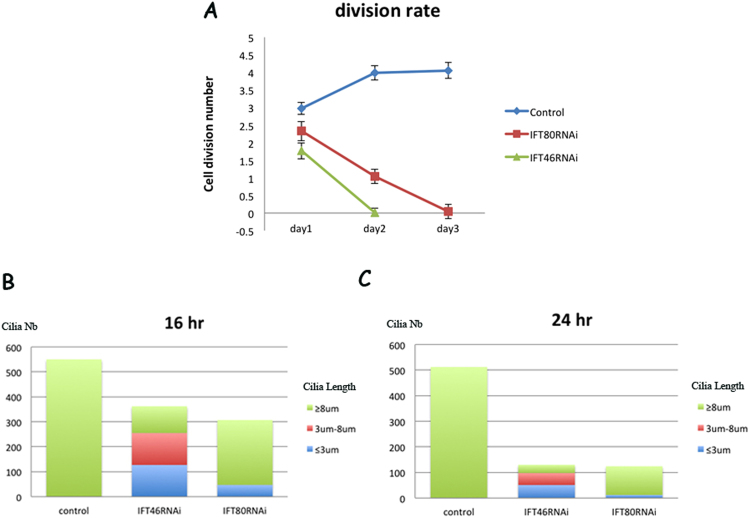
Figure 2.
Analysis of cilia defects caused by the knockdown of IFT46 and IFT80 in Paramecium. (A) The three coloured lines show different division rates after wild-type Paramecium cells were fed on Day 1, Day 2 and Day 3. The blue line represents the division rate of ND7 RNAi clones as control, the red line represents the division rate of IFT80 RNAi clones, and the green line represents the division rate of IFT46 RNAi clones. (B,C) These two graphs describe the changes in length and number of cilia after wild-type Paramecium cells were treated with different RNAi for 16 or 24 h.

