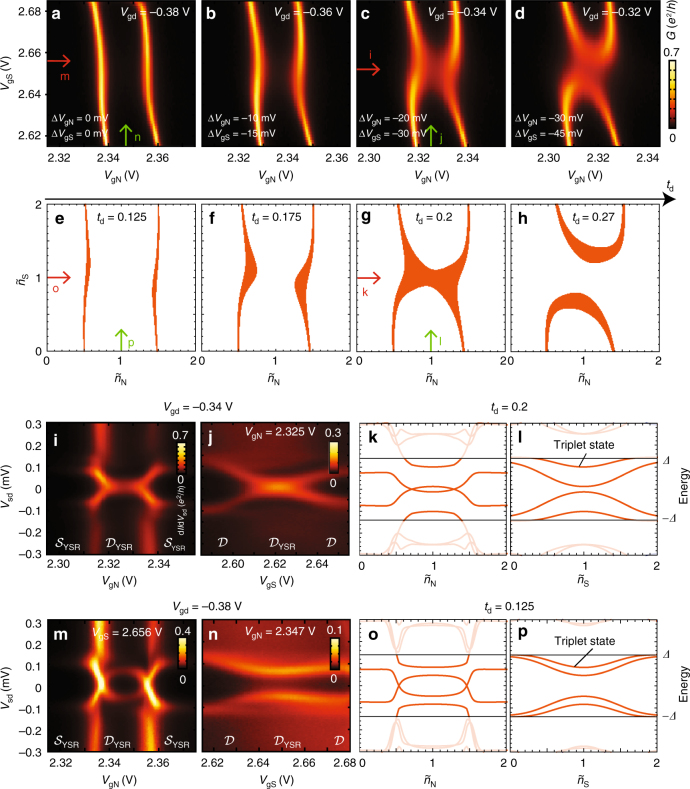
Fig. 4.
Tuning interdot coupling td. a–d Stability diagrams for different voltages on the tuning gate gd while compensating on plunger gates (T = 30 mK). The plot in d is analyzed in Fig. 3 and the voltage on gd is decreased in steps of −20 mV from d to a (compensating in steps of 10 and −15 mV on gN and gS, respectively). e–h, Stability diagrams generated by the zero-bandwidth model for different td (in meV), qualitatively reproducing the experimental behavior in a–d. Orange regions marking ground state transition have singlet-doublet splitting less than 0.015 meV. i, j, m, n Bias spectroscopy of sub-gap states vs. individual plunger gates swept along red, and green arrows in c and a. All plots show clear sub-gap resonances consistent with the ground states (doublet or singlet ) for different gate voltages indicated below. k, l, o, p Zero-bandwidth model calculation of sub-gap excitations for td = 0.2 meV and td = 0.125 meV corresponding to experimental plots i, j, m, n. The triplet excitation has very low spectral weight and therefore does not show up in the measured bias spectroscopy. Parameters are fixed to the same values as in Fig. 3

