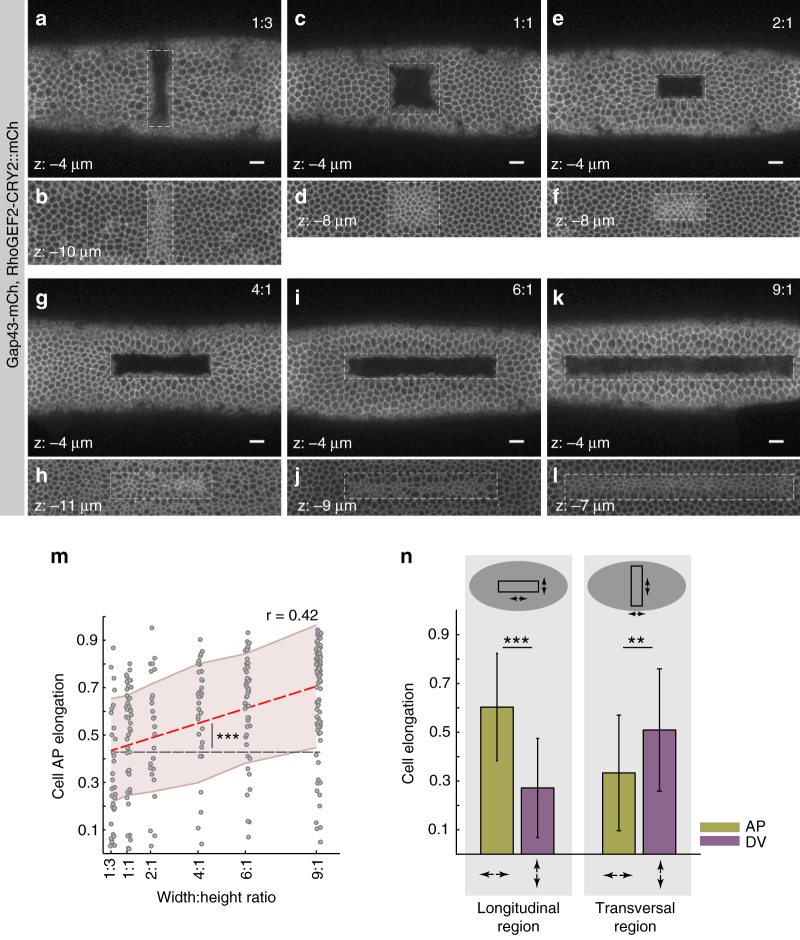
Fig. 7.
The geometry of synthetic contractile domains determines the orientation of cell contraction. a–n Confocal images of six embryos co-expressing CIBN::pmGFP, RhoGEF2-CRY2::mCherry, and Gap43::mCherry. A single rectangular area of varied width to height ratio (3:1, 1:1, 2:1, 4:1, 6:1, 9:1) was photo-activated on the dorsal epithelium of different embryos. Sustained photo-activation was alternated with mCherry excitation at intervals of ~19 s. After ~6 min, a z-stack was acquired in the mCherry channel to visualize the plasma membrane, note that at the used setting, the RhoGEF2-CRY2::mCherry signal was not visible. Dashed line indicates the area of photo-activation. Scale bars, 10 µm. a, b Surface views at a depth of 4 and 10 µm for a photo-activation area with a ratio of 1:3. c, d Surface views at a depth of 4 and 8 µm for a photo-activation area with a ratio of 1:1. e, f Surface views at a depth of 4 and 8 µm for a photo-activation area with a ratio of 2:1. g, h Surface views at a depth of 4 and 11 µm for a photo-activation with a ratio of 4:1. i, j Surface views at a depth of 4 and 9 µm for a photo-activation with a ratio of 6:1. k, l Surface views at a depth of 4 and 7 µm for a photo-activation with a ratio of 9:1. m Quantification of cell elongation along the anterior–posterior embryonic axis (AP elongation, y-axis) in relation to the geometrical pattern of photo-activation measured by the width:height ratio, x-axis. (3:1, n = 34; 1:1, n = 43; 1:2, n = 25; 1:4, n = 32; 1:6, n = 52; 1:9, n = 91). Linear regression analysis reveals a direct relation between cell anisotropy and geometry of activation (red dashed line, slope of 0.032 ± 0.0079, Pearson’s correlation coefficient of 0.42, ***p-value of 7.01 × 10⁻¹⁴, right-tail t-test against a null hypothesis of a slope equal to zero, black dashed line). Shaded areas indicate root-mean-square deviation (RMSD). n Comparison of AP and DV cell elongation between a longitudinal (left) and transversal (right) rectangular pattern of photo-activation. While cell elongation occurs mainly along the AP axis in a longitudinal area of photo-activation, it reorients along the DV axis in the case of a transversal area of photo-activation (*p-value < 0.005, ***p-value < 0.0001, two-tailed paired t-test)

