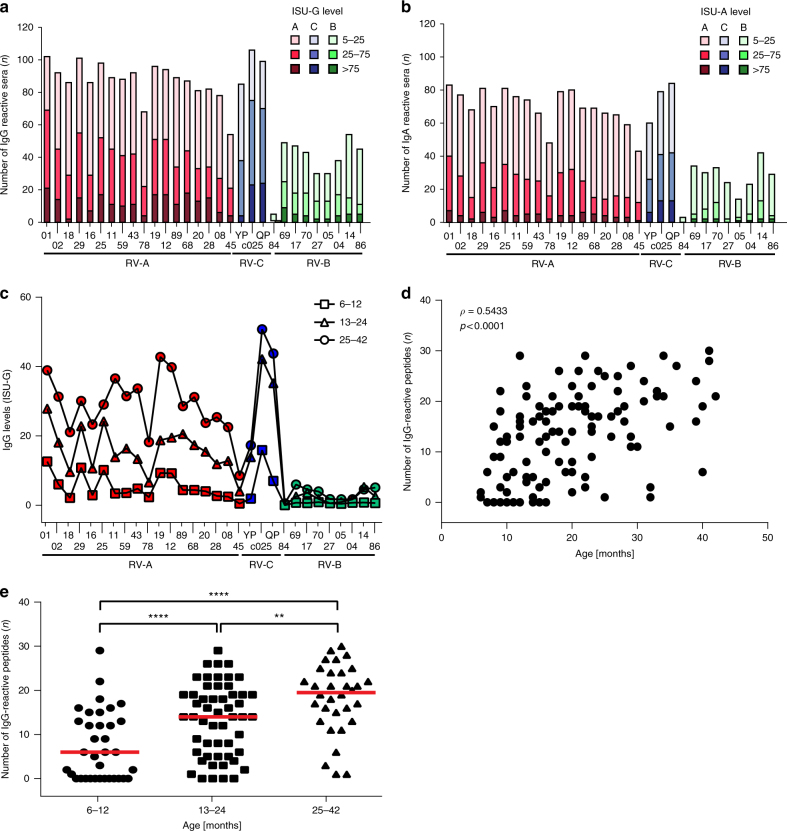
Fig. 2.
RV-specific antibody responses in sera from children with acute wheeze. Frequencies and levels of a IgG and b IgA responses (y-axes: n, number of reactive sera) to the N-terminal VP1 peptides from 30 RV strains (Supplementary Tables 2 and 4) (x-axes: red: RV-A species; green: RV-B species; blue: RV-C species). Antibody levels are color-coded and expressed as ISAC standardized units, ISU-G and ISU-A, respectively. c Median IgG levels (y-axis: ISU-G) to VP1 peptides (x-axis) in children grouped according to age (6–12 months: squares; 13–24 months: triangles; 25–42: circles). d Spearman’s rank correlation between the number of IgG-reactive peptides (n, y-axis; median IgG >15 ISU) and age (x-axis: months). Correlation coefficient (ρ) and p-value are shown. e Comparison of the number of IgG-reactive VP1 peptides (n, y-axis; median IgG >15 ISU) in children according to age (x-axis). Horizontal lines indicate medians. Statistically significant differences between groups are indicated (**p < 0.01, ****p < 0.0001) (Mann–Whitney U-test)

