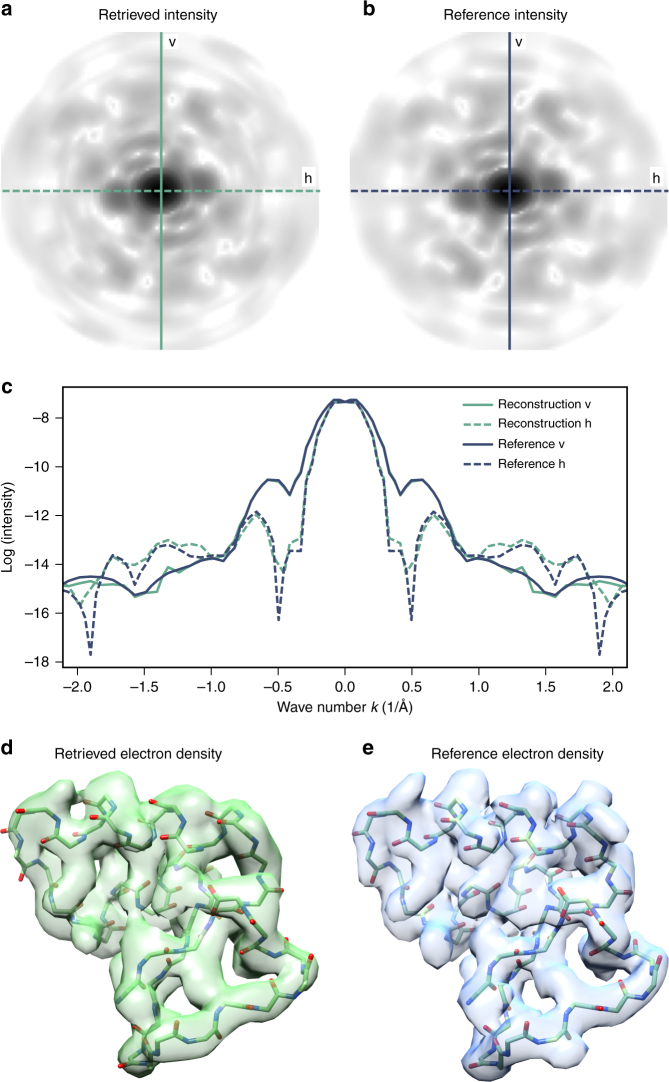
Fig. 2.
Structure determination at 3.3 Å resolution. Comparison of the retrieved density (green lines and structure) and the reference density of Crambin (blue lines and structure) in Fourier space and real space. Shown are averages over 20 structure determination runs, each using the same 3.3 × 10⁹ images with an average of 10 photons per image yielding 3.3 × 10¹⁰ photons. A cutoff in reciprocal space of kcut = 2.15 Å−1 was used and the intensity was expanded with K = 26 shells using an expansion order of L = 18. a, b Comparison of the the retrieved intensity (a) and the reference intensity (b) in the kxky-plane (logarithmic shading). c Comparison of two orthogonal linear cuts (vertical, v, and horizontal, h) through the kxky-planes shown in a and b. d, e Comparison of the retrieved electron density (d) and the reference electron density (e). The latter was calculated from the known Fourier density using the same cutoff kcut = 2.15 Å−1 in reciprocal space as in d. The resolution of the retrieved density is 3.3 Å, the resolution of the reference density is 2.9 Å, and the cross-correlation between the two densities is 0.9

