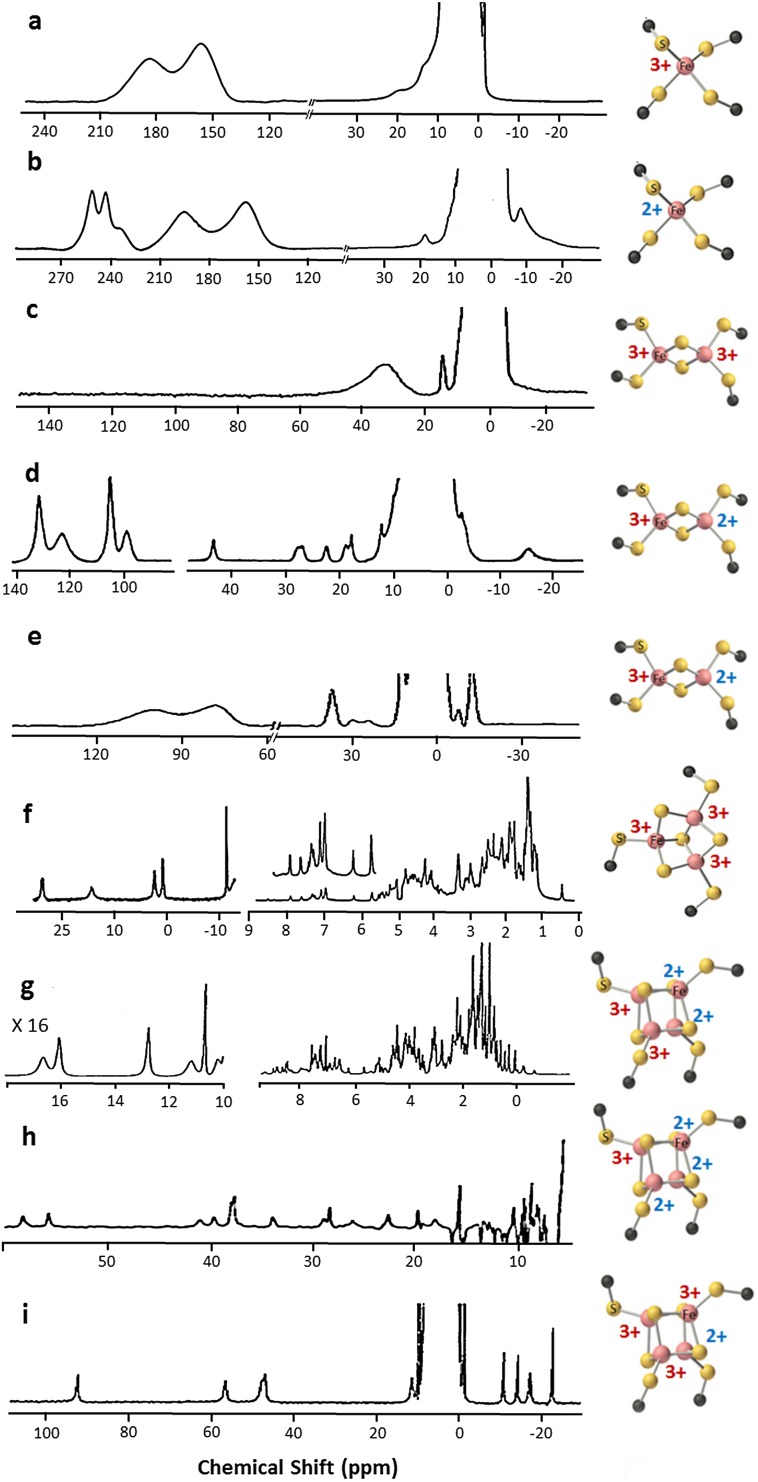
Fig. 1.
1D 1H NMR spectra of different Fe–S cluster types. 400 MHz 1D 1H NMR spectra of Fe3+ (a) and Fe2+ (b) C. pasteurianum rubredoxin, acquired at 308 K (adapted from [13]); c 200 MHz 1D 1H NMR spectrum of [2Fe–2S]2+ P. umbilicalis ferredoxin, acquired at 303 K [15]; d 360 MHz 1D 1H NMR spectrum of [2Fe–2S]+ P. umbilicalis ferredoxin, recorded at 303 K [25]; e 400 MHz 1D 1H NMR spectrum of [2Fe–2S]+ human ferredoxin, acquired at 303 K [201]; f 500 MHz 1D 1H NMR spectrum of [3Fe–4S]+ P. furiosus ferredoxin, recorded at 303 K [33]; 600 MHz 1D 1H NMR spectra of [4Fe–4S]2+, g [40] and [4Fe–4S]3+, i [60] E. halophila HIPIP II, recorded at 300 K; h 600 MHz 1D 1H NMR spectrum of [4Fe–4S]+ C. acidi urici ferredoxin, acquired at 298 K [43]

