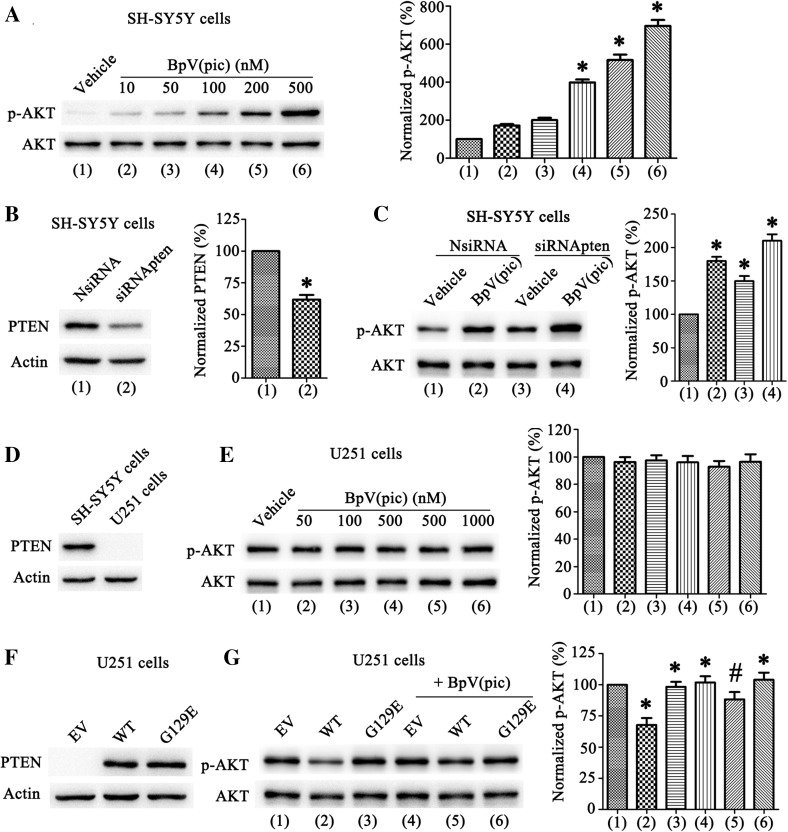
Fig. 3.
BpV(pic) up regulates p-AKT level through inhibiting PTEN lipid phosphatase activity. a Western blots analysis of p-AKT levels in SH-SY5Y cells treated with bpV(pic) (10–500 nM) in the right. Left: quantification analysis of p-AKT levels treated with bpV(pic) shown an increased expression of normalized p-AKT compare with vehicle group (n = 6 independent cultures, *P < 0.05 vs. the vehicle). b In SH-SY5Y cells PTEN expression decreased after transfected with siRNApten (n = 6 independent cultures, *P < 0.05 vs. the NsiRNA). c The p-AKT levels in SH-SY5Y cells transfect with NsiRNA or siRNApten then treated with bpV(pic) (200 nM) (n = 6 independent cultures, *P < 0.05 vs. the NsiRNA + vehicle). d Western blots analysis of PTEN expression in SH-SY5Y and U251 cells. e The level of p-AKT in U251 cells treatment with bpV(pic) (50–1000 nM) did not change (n = 6 independent cultures). f Western blots of PTEN expression in U251 cells transfected with PTEN-cDNA WT and G129E. g The levels of p-AKT in U251 cells transfected with PTEN-cDNA WT and G129E, then treatment with bpV(pic) (200 nM) (n = 6 independent cultures, *P < 0.05 vs. the EV, #P < 0.05 vs. the WT). The data are expressed as mean ± SE. The datas are expressed as mean ± SE. Statistical analysis was implemented by student’s t-test and variance analysis

