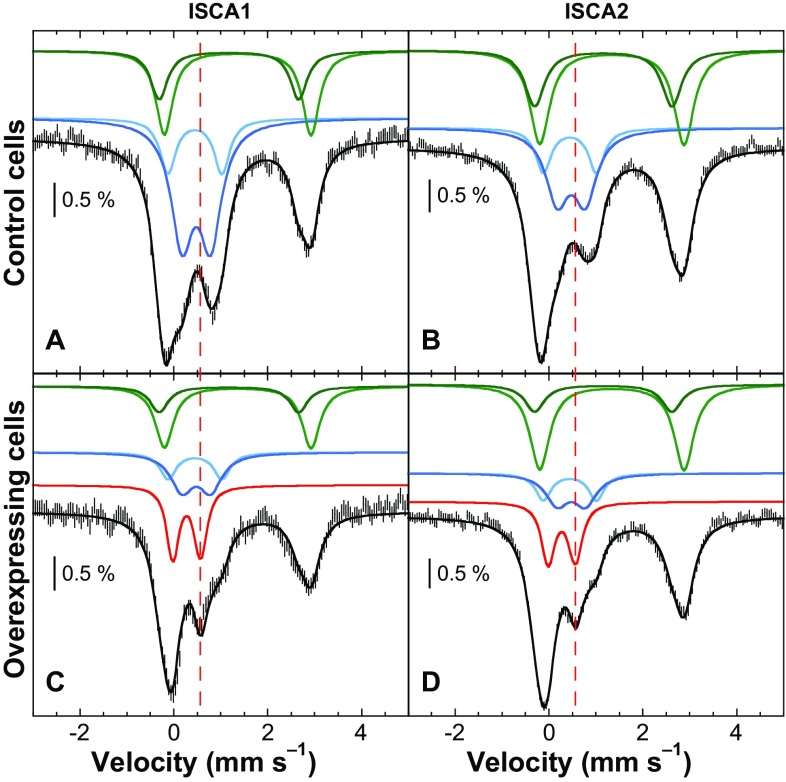
Fig. 4.
Mössbauer spectra recorded at 5.5 K using a 60 mT external magnetic field applied parallel to the γ-beam. The panels a and b reproduce spectra of whole control cells and panels c and d those of ISCA1 or ISCA2-overexpressing cells. Experimental spectra are shown with hatched marks and simulations are overlaid as solid black lines. Five components were used for simulation: HS FeII (light and dark green), [4Fe-4S]2+ clusters and LS ferrous hemes (light blue), FeIII NP (dark blue) and [2Fe-2S]2+ (red). From [55]

