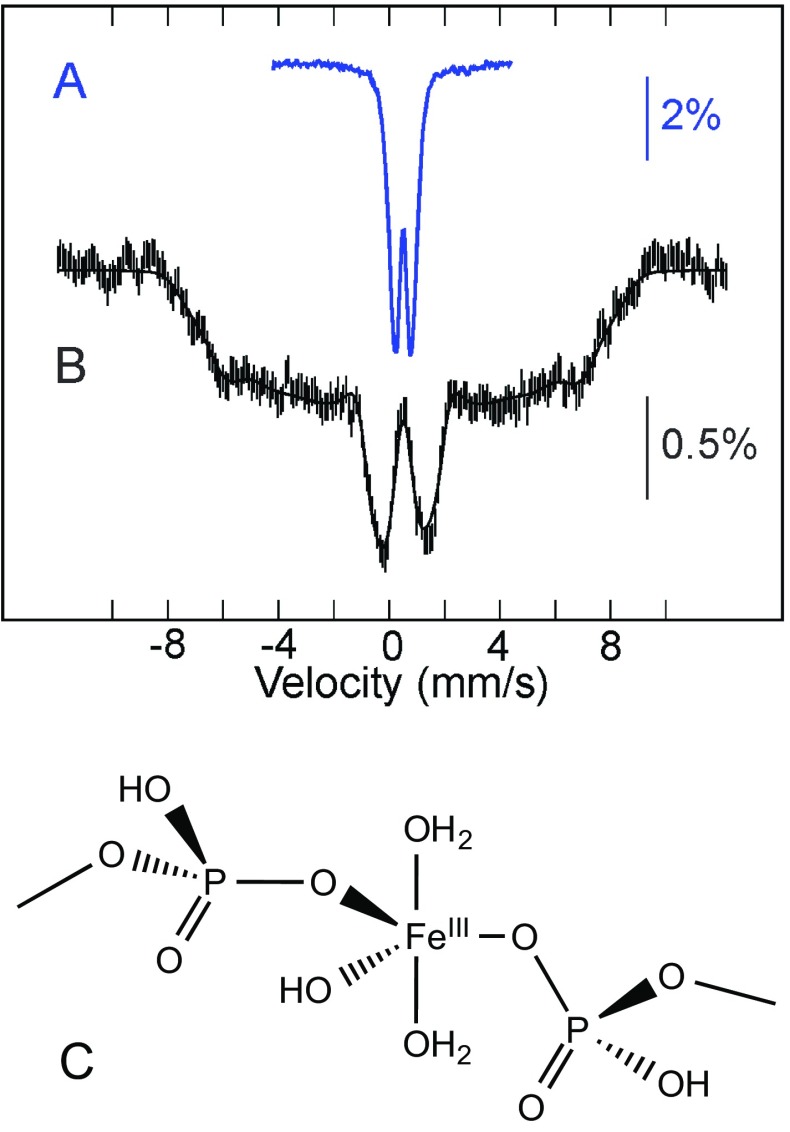
Fig. 5.
Top: Mössbauer spectra of ∆yfh1 yeast mitochondria. Spectrum a was recorded at 78 K in zero field and spectrum b at 4.2 K in a 7 T magnetic field applied parallel to the γ-beam. Experimental spectra are shown with hatched marks and simulations are overlaid as solid lines. Simulation of spectrum b was achieved assuming a distribution of the hyperfine field. From [59]. Bottom (c): Coordination of the ferric ion in NP according to EXAFS and electron microscopy results [60]

