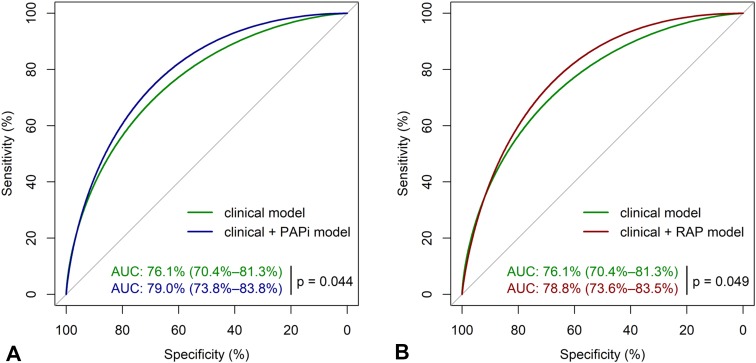
Fig. 3.
AUC analysis for the prediction of postoperative AKI stage 3. PAPi pulmonary artery pulsatility index, RAP right atrial pressure, AUC area under the receiver operating characteristic (ROC) curve with p value for the difference between different models. Only predictors that remained significant (p < 0.05) in the final model were used to assess discriminative power, and those were patient body mass index, baseline estimated glomerular filtration rate (eGFR), postoperative right ventricular failure, and the postoperative use of induction therapy. a The ROC curves of clinical model (green) and clinical model + PAPi (blue) for the prediction of AKI stage 3 with AUC and corresponding 95% confidence intervals; b The ROC curves of clinical model (green) and clinical model + RAP (red) for the prediction of AKI stage 3

