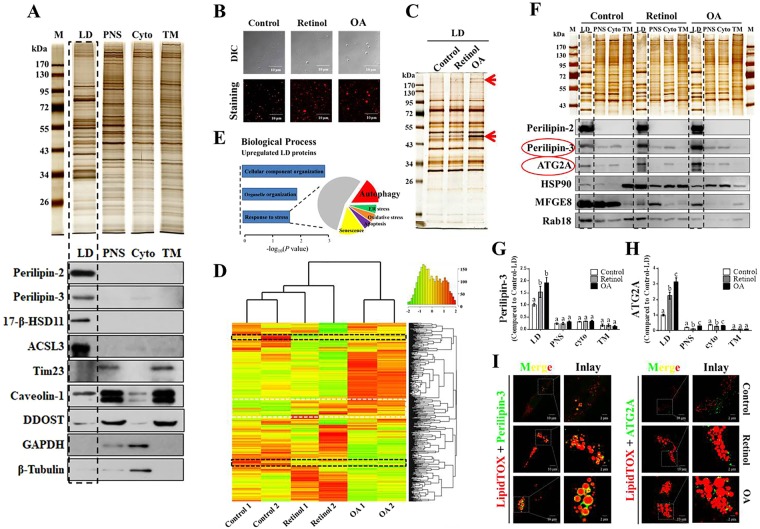
Figure 3.
Proteomic analysis reveals differentially expressed lipid droplet (LD) proteins during the reversion of activated LX-2 cells induced by retinol or oleic acid (OA). (A) Silver stained SDS-PAGE gel and immunoblots of various cellular location markers for the equal-loading proteins from isolated LDs, postnuclear supernatant (PNS), cytosol (Cyto), and total membrane (TM) fractions. (B) Isolated LDs in retinol or OA treatment observed by confocal microscopy. (C) Silver stained gel of LD proteins and some distinct protein bands indicated by red arrows. (D) Heat map visualization of LD protein composition from TMT-based mass spectrometry and proteins commonly upregulated (white dashed line) and downregulated (dark dashed line) upon retinol or OA treatment. (E) Biological processes associated with upregulated proteins based on the KEGG web database. (F–H) Validation of changes observed in quantitative proteome; six LD proteins (perilipin-2, perilipin-3, ATG2A, HSP90, MFGE8, and Rab18) were assessed by immunoblotting, and associated quantification is shown. (I) Localization of perilipin-3 and ATG2A on LDs based on immunofluorescence. Full-length blots are presented in Supplementary Figure 6. Significant differences (p < 0.05) are indicated by different letters.

