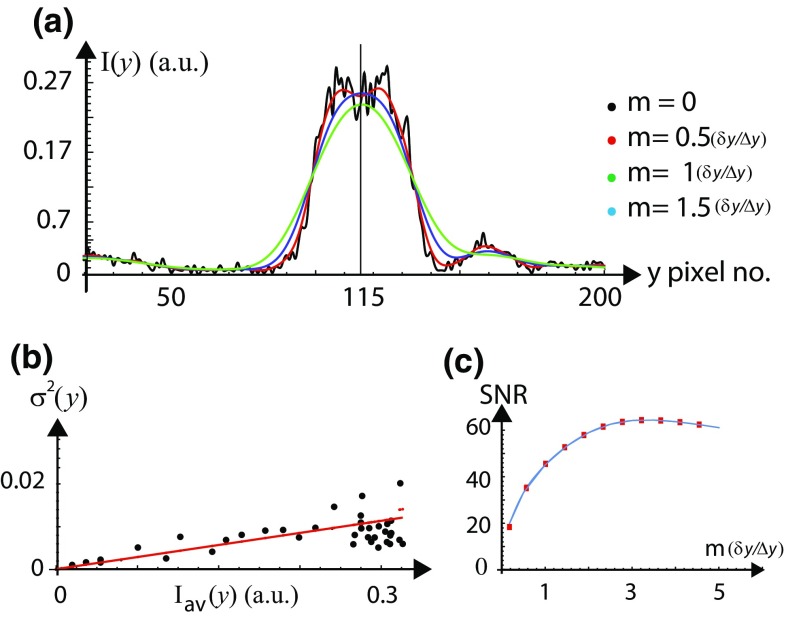
Fig. 5.
Improving the signal-to-noise ratio (SNR) of a feature in the image shown in Fig. 1c at cross section I. a Transverse 1-D fluorescence intensity profiles (arbitrary units, plotted against pixel number) are plotted on top of each other for (black), (0.5 (red), ( (green) and (1.5 (blue), for judging the smoothening operation. The PSF width in pixels is () for this image. The jump in the intensity profile before pixel no. and beyond pixel no. is an artifact. b Plot of noise variance () vs. average 1-D fluorescence intensity () of the tube. The red line shows a model fit to the data. c Signal-to-noise ratio (SNR) is plotted as a function of the smoothening radius m in the units of . The peak signal-to-noise ratio (SNR) of the feature is improved from up to 64 by smoothening operation

