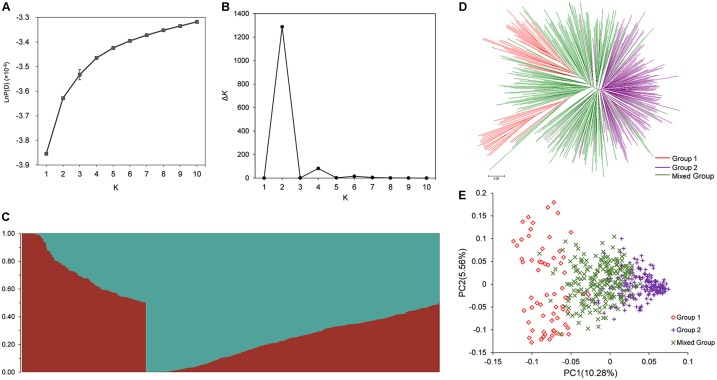
FIGURE 2.
Population structure analysis of association population in rapeseed. (A) The variation trend of LnP(K) with change of K-value from 1 to 10. (B) Delta K based on the rate of change of LnP(K) between successive K. (C) Population structure defined by STRUCTURE when K = 2. (D) NJ tree analysis based on 472 rapeseed accessions. (E) Principal component analysis based on 472 rapeseed accessions. 472 lines were clustered into Group 1, Group 2, and Mixed Group based on the ΔK-value and the probability of membership.

