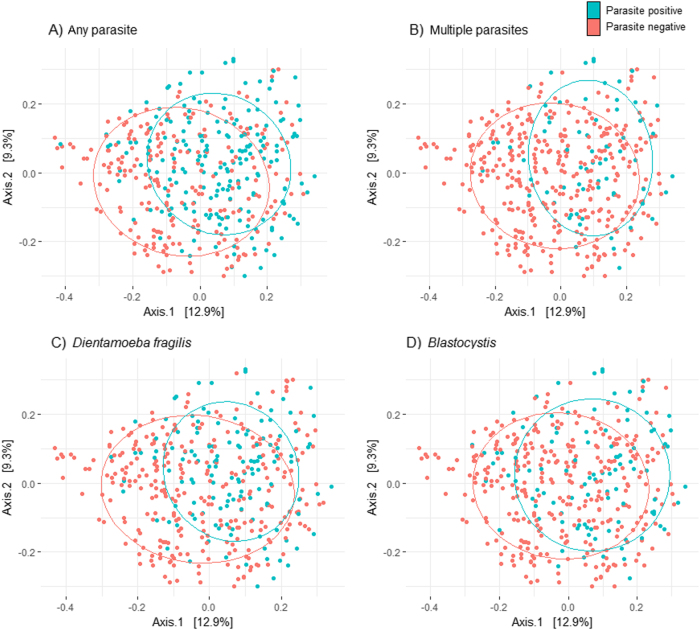
Fig. 1. PCoA of the bacterial microbiome according to parasite colonisation status.
Principal coordinate analysis visualizing differences in the bacterial microbiome between samples positive and negative for any parasite (a), multiple parasites (b), Dientamoeba fragilis (c), and Blastocystis (d). All samples are included in the analysis (n = 419). Blue dots represent samples positive in the given parasite category while negative samples are represented by red dots. The closer the dots are ordinated, the more similar the microbiome. Axes summarize the variability in the data, and the value indicates the variation captured in the axis

