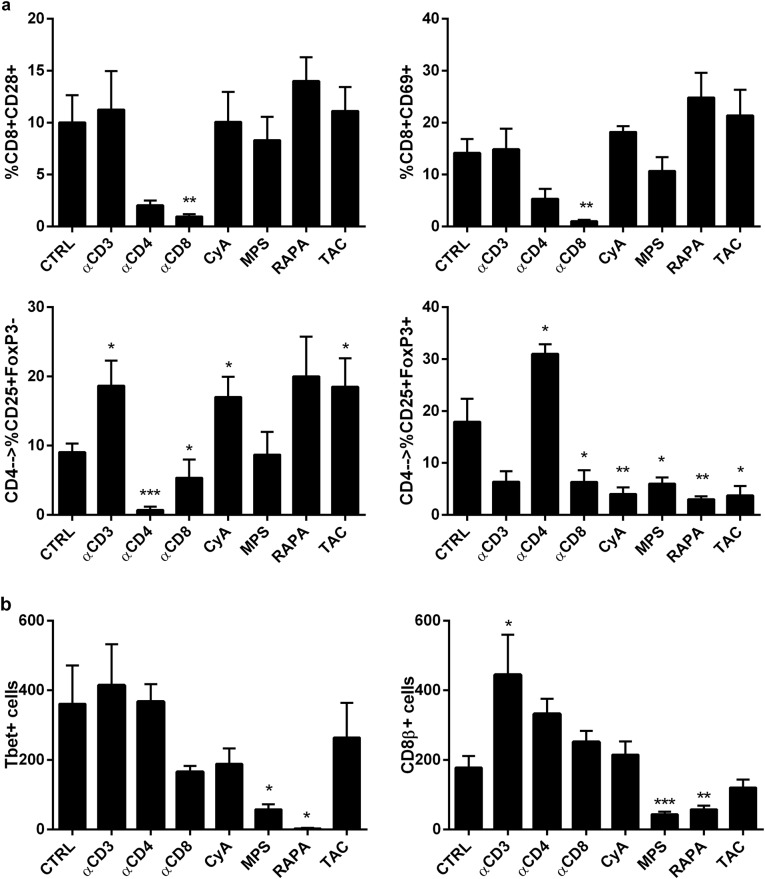
Fig. 4. Effects of different immunosuppressants on the mucosal immune microenvironment.
a Mouse colonic samples were incubated in HBSS supplemented with 1 mM DTT and 0.5 mM EDTA with shaking at 37 °C for 20 min. After washing, the tissues were treated with 1 U/ml dispase (Stemcell Technologies) in DMEM containing 5% FCS at 37 °C for 30 min with gentle stirring. Single-cell suspensions were subjected to flow cytometry to determine the proportion of activated CD8+ T cells (positive for CD28 and CD69) and CD4+ T cells (CD25+FoxP3− and CD25+FoxP3+). Flow cytometric analysis was performed using a FACSCalibur based on CellQuest software (Becton Dickinson). The antibodies used are summarized in Supplementary Table 4. b Immunohistochemical analyses were performed using standard procedures, and the resulting sections were evaluated by a single pathologist in a blinded fashion. The antibodies used for immunohistochemistry are shown in Supplementary Table 3. Cells expressing CD8β and Tbet were manually counted at 40× magnification in 10 random fields from consecutive slides (n = 6 for each treatment group). Each treatment group was compared to control mice who were treated only with AOM and DSS. Statistical significance was assessed by Mann–Whitney U tests (*p < 0.05, **p < 0.01, ***p < 0.001)

