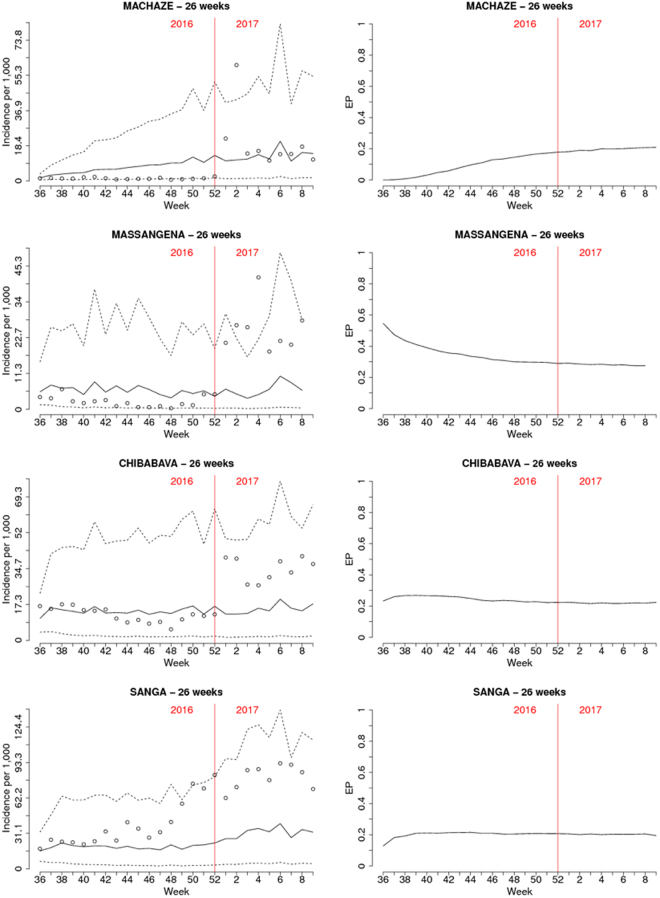
Figure 3.
Prediction results for the districts of Machaze, Massangena, Chibabava, and Sanga over the following 26 weeks after the 35th week in 2016. The left panels show the posterior mean (solid line) and 95% credible intervals (dashed lines) for malaria incidence. The right panels show the exceedance probability for a relative risk threshold of 2. Dots show observed incidence. The results for the 9th week in 2017 of Massangena district are not reported because the incidence data were not available.

