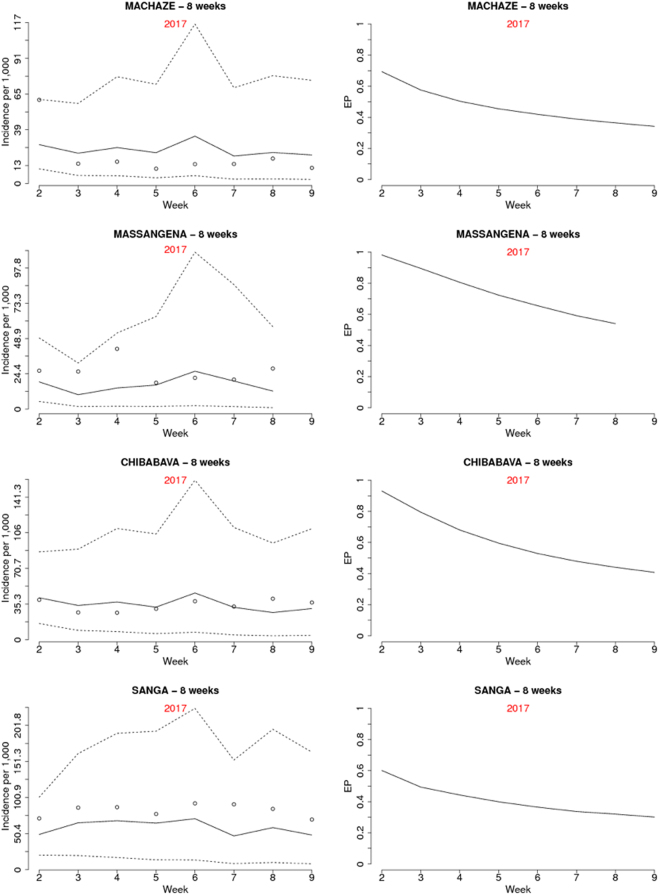
Figure 5.
Prediction results for the districts of Machaze, Massangena, Chibabava, and Sanga over the following 8 weeks after the 1st week in 2017. The left panels show the posterior mean (solid line) and 95% credible intervals (dashed lines) for malaria incidence. The right panels show the exceedance probability for a relative risk threshold of 2. Dots show observed incidence. The results for the 26th week (the 8th week of the hold-out sample) of Massangena district are not reported because the incidence data were not available.

