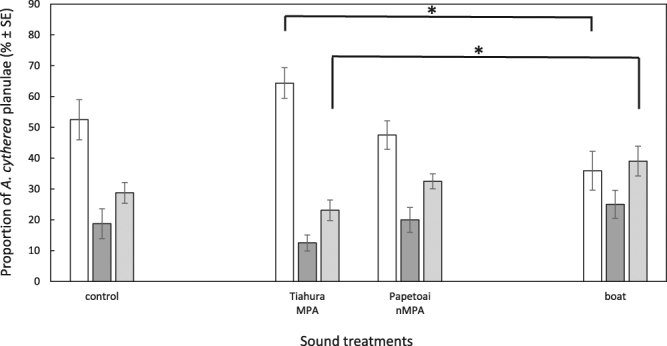
Figure 4.

Distribution of Pocillopora damicornis planulae (% ±SE) in the choice chambers. Results at t = 4 h for the different sound treatments: no sound (control) (n = 13), Tetaiuo MPA sounds (n = 12), Gendron non-MPA sounds (n = 12), Tiahura MPA sounds (n = 12), Papetoai non-MPA sounds (n = 12), Nuarei MPA sounds (n = 12), Temae non-MPA sounds (n = 12) and boat noise (n = 13). Stars indicate significant differences in the proportion of planulae between sound treatments and the control condition in the live (white stars) and dead CCA arms (light grey star). Asterisks indicate significant differences in the proportion of planulae between MPAs and their respective non-MPA sound treatments at an alpha level of 0.05. Results are from a 2-way ANOVA followed by Tukey HSD post hoc tests. Live CCA arms are in white, dead CCA arms are in light grey, central compartments (no choice) are in dark grey.
