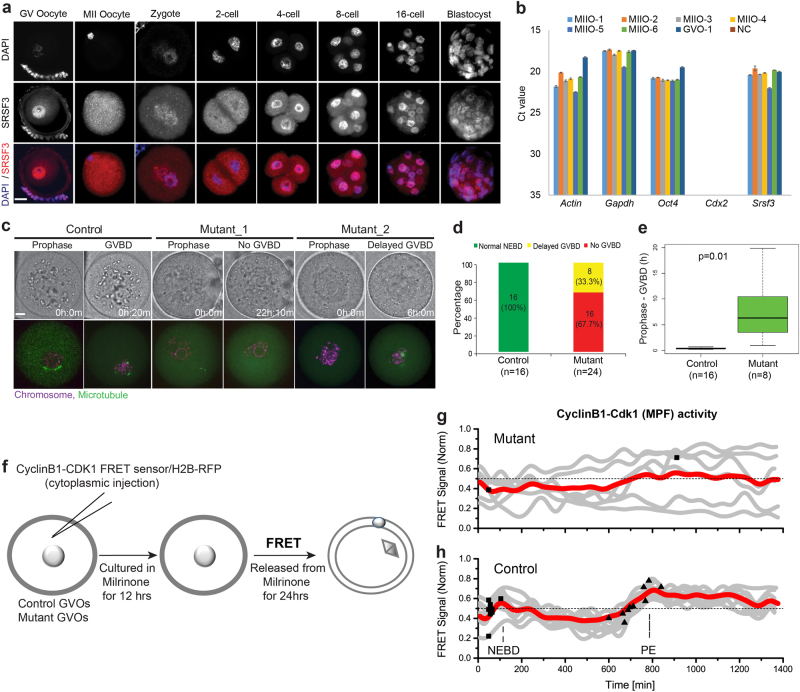
Fig. 1. Srsf3 knockout oocytes show a major defect in meiotic resumption.
a Immunostaining shows SRSF3 protein expression in GV oocytes, MII oocytes and preimplantation embryos. Scale bar: 100 µm. b Single cell quantitative real-time PCR shows Srsf3 mRNA expression in MII oocytes and GV oocytes. NC negative control, M2O MII oocyte, GVO GV oocyte. c Time-lapse confocal live imaging of control and mutant oocytes microinjected with H2B-RFP and EB3-mEGFP RNAs. Chromosome in magenta, microtubule in green. Scale bar: 20 µm, h hour, m minute, GVBD: nuclear envelope breakdown. d A graph shows the percentage of control and mutant oocytes undergoing normal GVBD, delayed GVBD, or no GVBD. Numbers of oocytes examined are shown under the graph. e A box plot shows timing from prophase I to GVBD in control and mutant oocytes. Numbers of oocytes examined are shown under the graph. p-value was calculated by two-tailed Student’s t-test. f Schematic illustration of Förster resonance energy transfer (FRET) experiment using a CDK1 FRET sensor to visualize CDK1 activation in control and mutant oocytes during meiosis. Milrinone was used to prevent oocytes from entering meiosis. g Gray lines are FRET curves of mutant oocytes. Red line is the mean of FRET curves of six mutant oocytes. Black squares represent the time point of GVBD. Only two mutant oocytes underwent GVBD during the course of live imaging. h Gray lines are FRET curves of control oocytes. Red line is the mean of FRET curves of ten control oocytes. Black squares represent time point of GVBD and black triangles represent the time point of the completion of polar body extrusion (PE), which is the first frame showing complete abscission of the polar body

