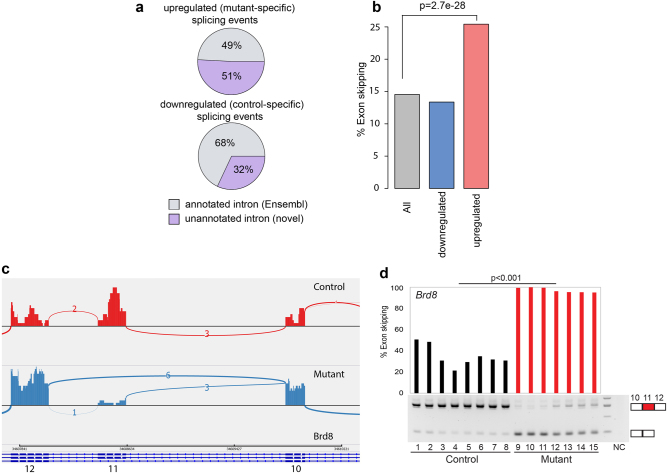
Fig. 3. Aberrant alternative splicing in Srsf3-mutant oocytes.
a Pie charts show percentages of annotated and unannotated splicing events in upregulated (mutant-specific) and downregulated (control-specific) splicing events. b A bar graph shows percentages of exon skipping in unannotated splicing events. All splicing events in gray, downregulated (control-specific) splicing events in blue, upregulated (mutant-specific) splicing events in red. c A representative sashimi plot shows an exon skipping event in Brd8 transcript in control and mutant oocyte. The numbers of junction reads between two connecting exon are shown in the sashimi plot. d Validation of the exon skipping on Brd8 transcript in control and mutant oocyte by semiquantitative PCR. Percentages of exon skipping calculated for eight control and seven mutant oocytes are shown on the top. Mann–Whitney test (Wilcoxon rank sum test) was used to calculate p-value

