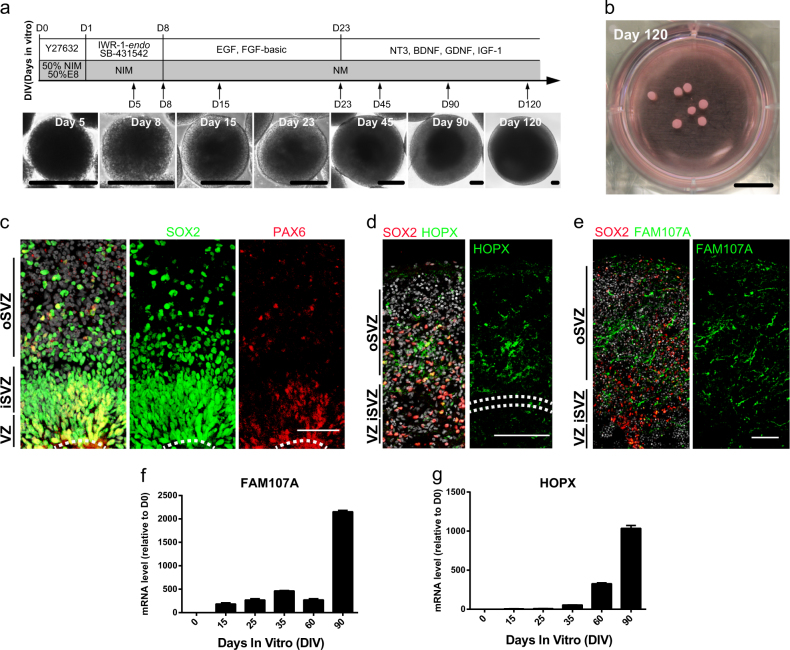
Fig. 1. Generation of telencephalon cortical organoids from hESCs.
a Schematic diagram of telencephalon cortical organoids derived from hESCs. Phase images of sample at different stages are shown. Scale bars: 200 μm. b Morphology of cortical organoids in a plate at day 120 in vitro. Scale bar: 1 cm. c Immunostaining of ventricular radial glia marker PAX6 (red) and neural progenitor cells marker SOX2 (green) in Hoechst-stained (HO, gray) telencephalon cortical organoids at D60, indicating the presence of a VZ-like and oSVZ-like region organized around a lumen (white dotted line). Scale bar: 50 μm. d, e Sample tiling images of immunostaining of oRGC markers HOPX (d) and FAM107A (e) in telencephalon cortical organoids. Scale bars: 100 μm. f, g Temporal pattern of oRGC markers FAM107A (f) and HOPX (g) expression in different stages of cortical organoids. Values represent mean ± SD, n = 3 for each point

