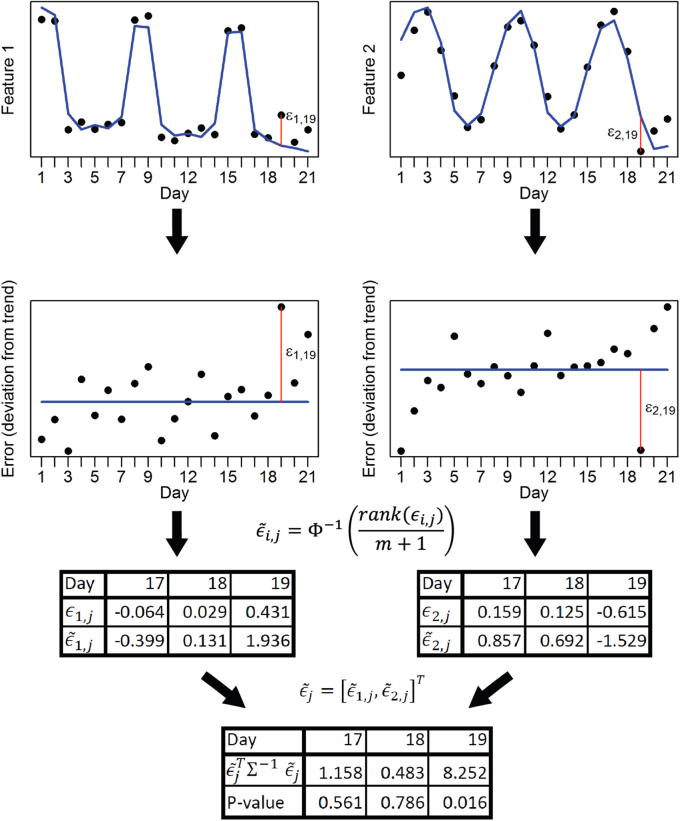
Figure 1.
Monthly rate of anomalies detected in the cohort of 15 patients with schizophrenia. After performing anomaly detection for each day of data collection for each patient across the sample, the frequency of anomalies detected at the 0.05 significance level per 30 days are calculated separately for each patient. These numbers should be compared to the expected number of anomalies under the null hypothesis, or 30*0.05 = 1.5 per 30 days. The distribution of anomaly rates in all data streams match tend to be centered near this null rate of 1.5 anomalies per 30 days. As a point of comparison, in the patients who relapsed the rate of anomalies within 2 weeks of hospitalization was 2.5 anomalies per 30 days

