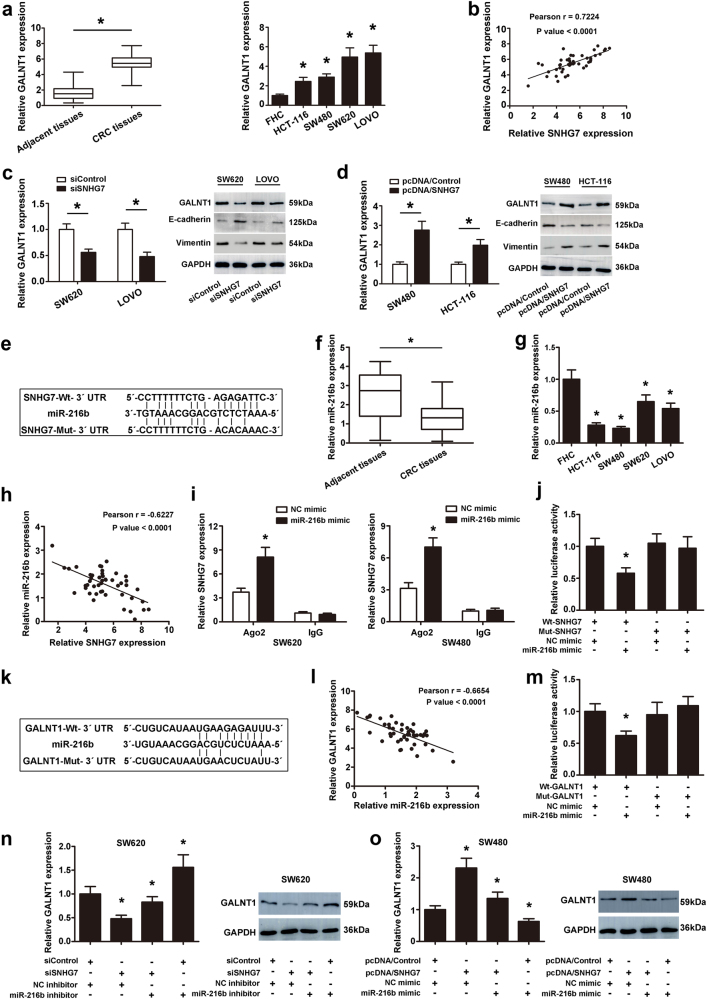
Fig. 4. SNHG7 acted as a ceRNA by sponging miR-216b and regulated GALNT1 expression indirectly.
a The differential expression of GALNT1 in CRC tissues and adjacent normal colon tissues was examined. Expressional levels of GALNT1 in CRC cell lines and FHC cell. b Pearson’s correlation curve identified positive correlation between SNHG7 and GALNT1 in CRC tissues. c The expressional levels of GALNT1 mRNA and protein, E-cadherin and Vimentin proteins in CRC cells transfected with siSNHG7 were evaluated by qRT-PCR and western blot. d The levels of GALNT1 mRNA and protein, E-cadherin and Vimentin proteins in CRC cells transfected with pcDNA/SNHG7 were evaluated by qRT-PCR and western blot. e The predicted binding sites of miR-216b to the SNHG7 sequence were shown. f The differential expression of miR-216b in CRC tissues and adjacent normal colon tissues was analyzed. g The levels of miR-216b was investigated in CRC cell lines and human normal colon cell line by qRT-PCR. h Pearson’s correlation curve revealed the negative relevance between SNHG7 and miR-216b expression. i RNA-IP was performed in SW620 and SW480 cells transfected with NC mimic and miR-216b mimic. SNHG7 expression was detected using qRT-PCR. j Luciferase activity of 293T cells cotransfected with miR-216b mimic and luciferase reporters containing SNHG7-Wt or SNHG7-Mut transcript were analyzed. k The predicted binding sites of miR-216b to the GALNT1 sequence were shown. l Pearson’s correlation curve revealed the negative relevance between GALNT1 and miR-216b levels. m Luciferase activity of 293T cells cotransfected with miR-216b mimic and luciferase reporters containing GALLNT1-Wt or GALNT1-Mut transcript were performed. n The levels of GALNT1 transfected with miR-216b inhibitor or siSNHG7 in SW620 cell were analyzed by qRT-PCR and western blot. o The levels of GALNT1 transfected with miR-216b mimic or pcDNA/SNHG7 in SW480 cells were analyzed by qRT-PCR and western blot. The error bars in all graphs represented SD, and each experiment was repeated three times. *p < 0.05

