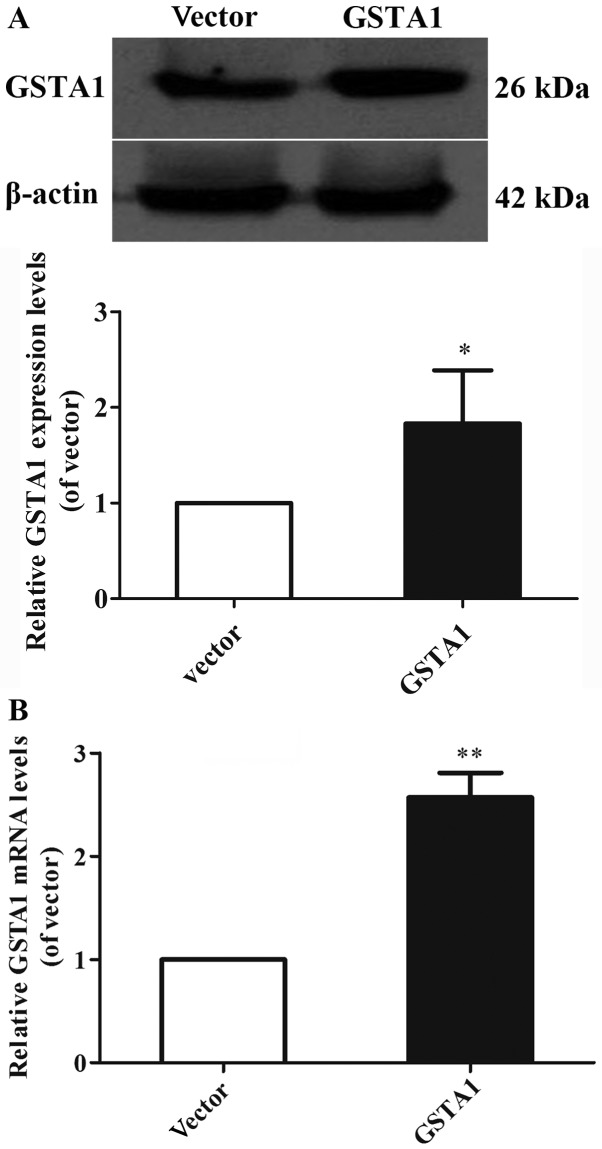
Figure 2.
GSTA1 protein, mRNA expression in GSTA1 and vector A549 cells. (A) The expression of GSTA1 was determined by western blot analysis. β-actin served as a loading control. (B) GSTA1 mRNA levels in GSTA1 and vector A549 cells were detected by a reverse transcription-quantitative polymerase chain reaction assay. GAPDH served as a loading control. Data are presented as the mean + standard deviation. *P<0.05, **P<0.01 vs. vector. GSTA1, glutathione S-transferase A1.

