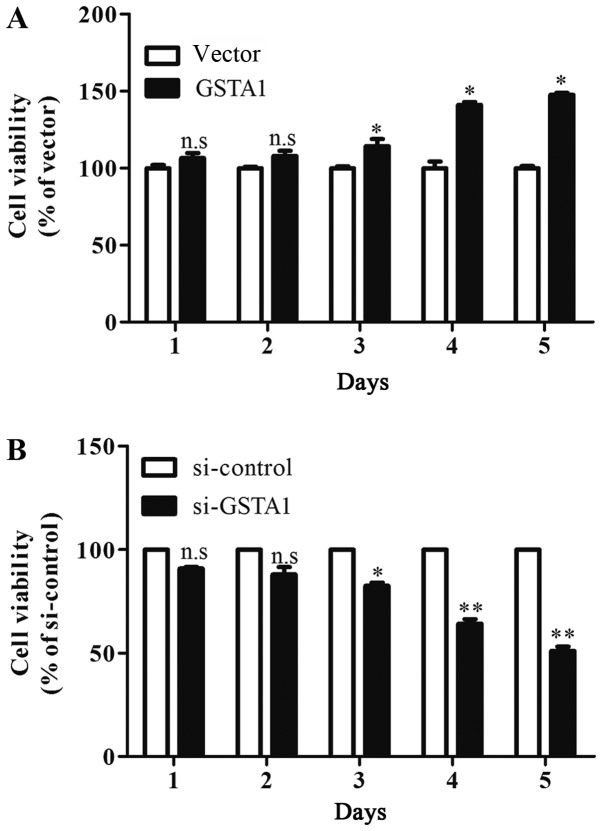
Figure 3.
Cell viability of A549 cells in vitro. (A) GSTA1 A549 cells were compared with vector control. *P<0.05 vs. vector. (B) si-GSTA1 A549 cells compared with i-control. *P<0.05, **P<0.01 vs. si-control. Data are presented as the mean + standard deviation. GSTA1, glutathione S-transferase A1; si, small interfering RNA; n.s, no significance.

