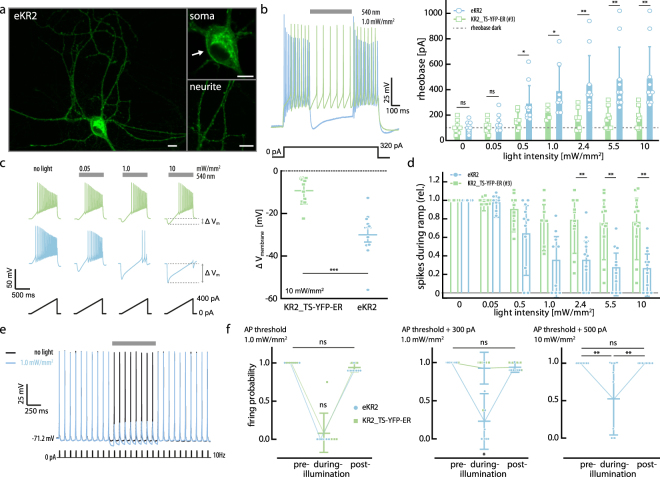
Figure 5.
Neuronal silencing performance of eKR2. (a) Confocal image of a hippocampal neuron in culture (Z stack) with zoom-ins (0.5-µm equatorial slice) on dendrites and soma; scale bar corresponds to 10 µm. (b) Left: Representative voltage traces recorded in current-clamp configuration using a squared somatic current injection protocol to determine the rheobase (540 nm LED, 500 ms) Right: Dependence of average rheobase on illumination intensity (mean ± SD; n = 10). Dotted line represents the average rheobase without illumination. (c) Left: current-clamp traces at different light intensities using a somatic current injection ramp protocol with 0.44 pA/ms (0 to 400 pA in 900 ms). Right: Cell hyperpolarization at 10 mW/mm2 green light stimulation (mean ± SD; n = 11). Delta membrane voltage was calculated as the minimum membrane voltage value under light stimulation minus the membrane voltage at 0 somatic current injection and no light stimulus. (d) Relative number of spikes during the ramp protocol at different light intensities normalized to no light stimulation (mean ± SD; n = 11). (e) Pulse trial protocol traces of an eKR2-expressing neuron with (light blue) and without (black) light stimulation; pulse width 10 ms, LJP corrected. (f) Firing probability during pulse trial protocol pre-, during, and post- light stimulation (mean ± SD; n = 11). Left: At AP threshold; middle: injection amplitudes at AP threshold plus 300 pA. Right: At AP threshold plus 500 pA (only eKR2). The Kruskal Wallis test was used followed by Dunn’s test.

