
Figure 5.
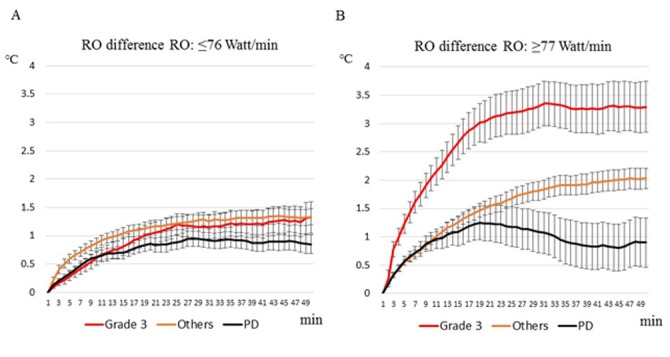
Changes of the surface skin temperature during the 50 min of irradiation according to treatment response and RO difference, (A) ≤76 Watt/min vs. (B) ≥77 Watt/min. Others include patients with grade 2-0 CR and PR-SD. Data in the figure are presented as means with standard error (SEM).