
Figure 1.
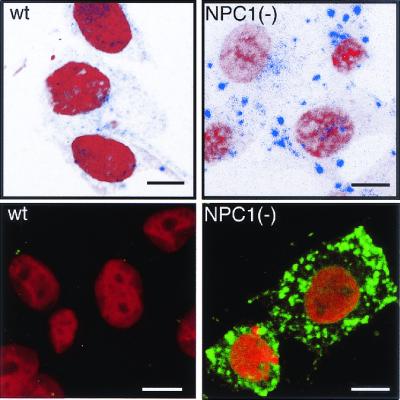
Intracellular distribution of CT in NPC1(−) cells. Cells were incubated with Cy5-CT (Upper) or FITC-CTB (Lower), fixed, and counterstained with propidium iodide. (Bar = 10 μm.)
Official websites use .gov
A
.gov website belongs to an official
government organization in the United States.
Secure .gov websites use HTTPS
A lock (
) or https:// means you've safely
connected to the .gov website. Share sensitive
information only on official, secure websites.
Intracellular distribution of CT in NPC1(−) cells. Cells were incubated with Cy5-CT (Upper) or FITC-CTB (Lower), fixed, and counterstained with propidium iodide. (Bar = 10 μm.)