Fig. 4.
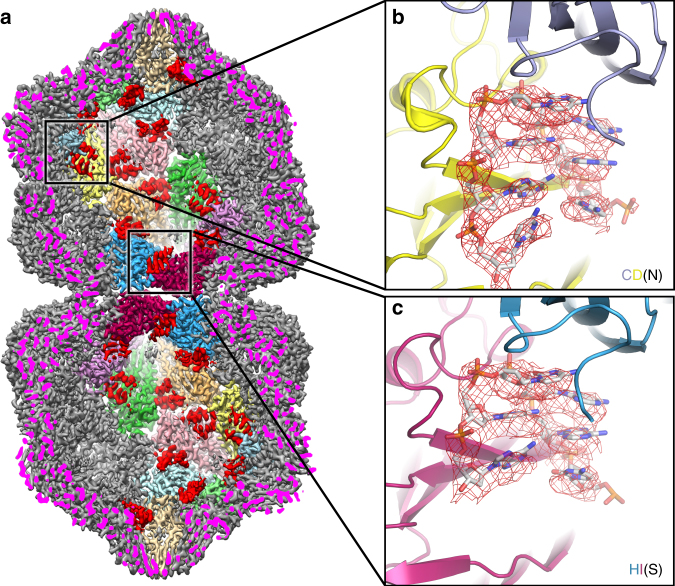
Single-stranded DNA binding. a Rear half of the EM density for AYVV at 3.3 Å resolution. The cut surface of the EM density is colored bright magenta for clarity. Two D5 asymmetric units are shown at the back of the capsid (colored as in Fig. 1a). High-resolution density corresponding to ssDNA is in red. b The EM density for 7 nucleotides of DNA is shown as a red mesh and the modeled atomic coordinates for CPs C and D and DNA stem loop N (CD-type DNA) is shown. These 7 nucleotides and the mode of binding to the neighboring subunits is identical for the majority of the CPs (i.e. A-G & I-K). At the interface (i.e. CPs H and I) these interactions are different, c shows 6 nucleotides, stem loop S, and the neighboring CPs H and I (HI-type DNA), depicted as described in b

