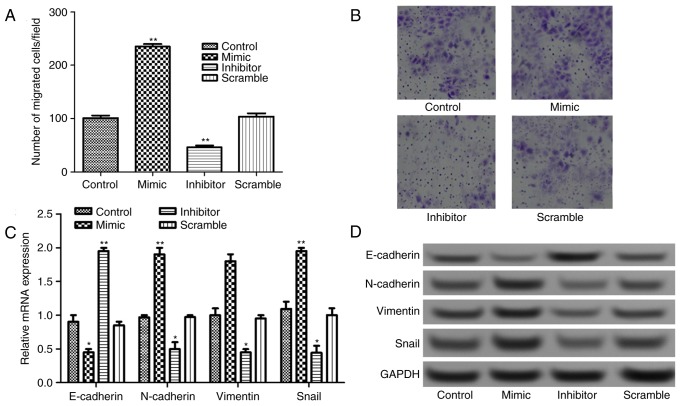
Figure 3.
(A) Quantification and (B) representative image of the cell viability assay after cell transfection with miR-885-5p mimic and inhibitor. Original magnification, ×200. The relative expression levels of epithelial-mesenchymal transition-related proteins (N-cadherin, E-cadherin, vimentin and Snail) after cell transfection assayed by (C) reverse transcription-quantitative polymerase chain reaction and (D) western blot analysis. *P<0.05 and **P<0.01 vs. the control group. miR, microRNA.

