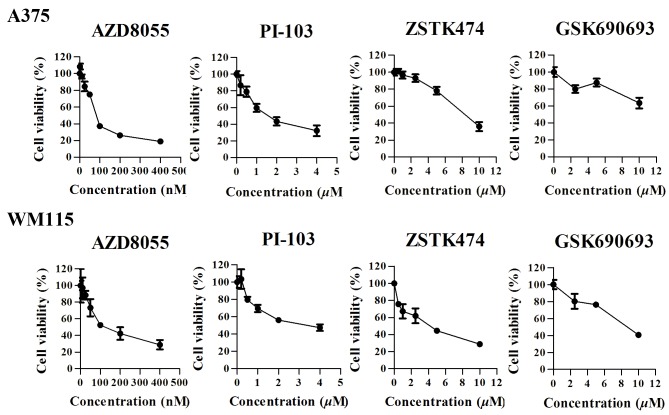
Figure 3.
Cell-growth response curves for melanoma cell lines A375 and WM115. Cells were treated with the indicated concentrations of PI-103, AZD8055, ZSTK474, or GSK6906930 for 72 h and cell viability was measured using a CCK-8 assay. Results represent the mean ± standard deviation of three independent experiments.

