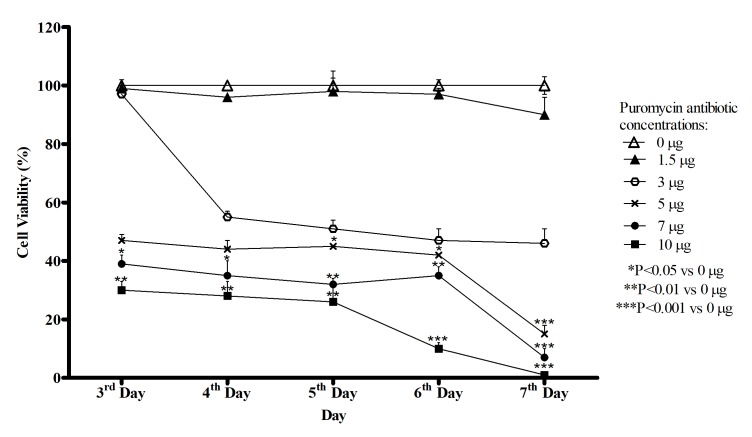
Figure 3.
Kill curve determination. HepG2 kill curves were constructed from day 3–7 using a range of puromycin concentrations. Data are presented as the mean ± standard deviation, and each group consists of technical triplicates for 3 biological replicates. *P<0.05 vs. 0 µg, **P<0.01 vs. 0 µg and ***P<0.001 vs. 0 µg.

