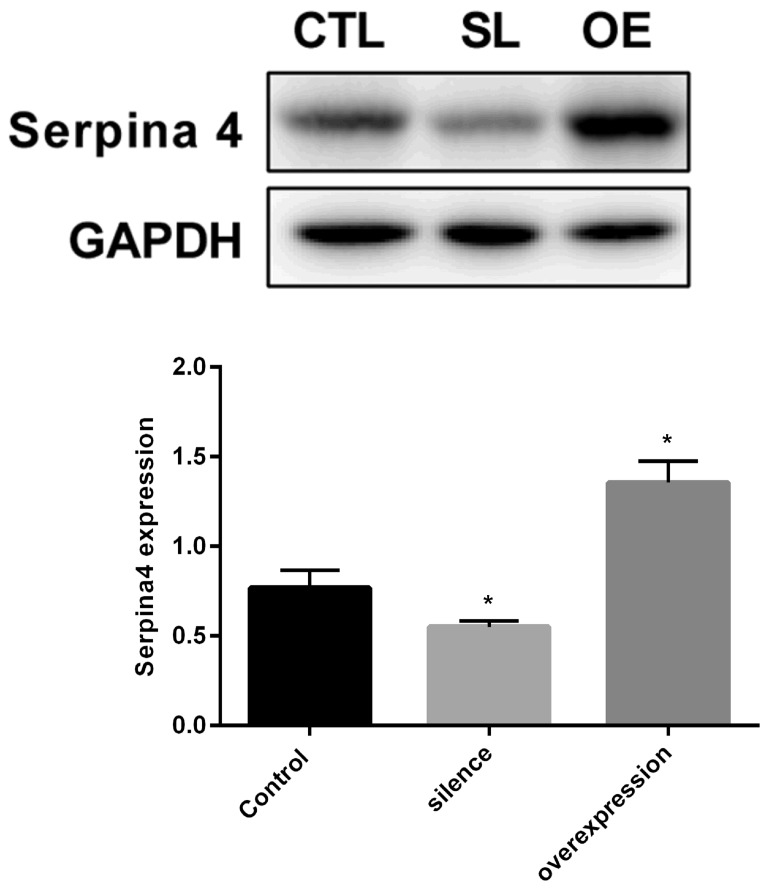
Figure 4.
Western blot analysis of SERPINA4 protein level in hsa_circ_0006215-silenced and -overexpressing cells compared with control cells. GAPDH protein was used as an internal control. Results are the mean ± standard error of the mean. *P<0.05 vs. control. hsa, human; circ, circular RNA; CTL, control group; SL, hsa_circ_0006215-silenced group; OE, hsa_circ_0006215-overexpressing group.

