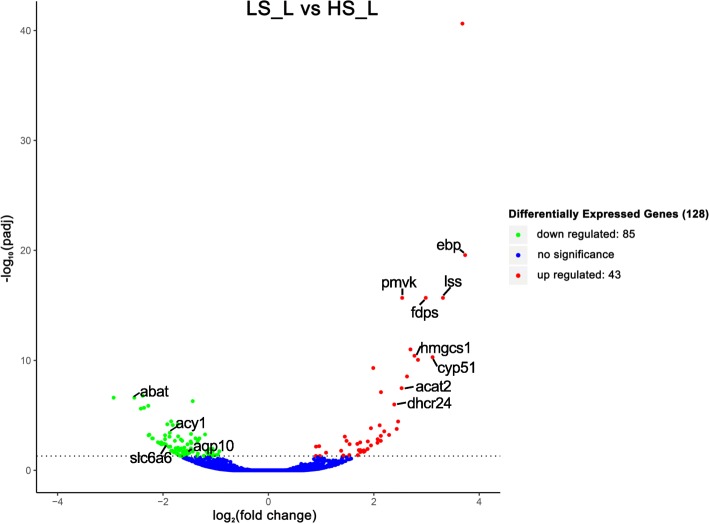
Fig. 1.
Volcano plot showing the gene expression differences between the LS_L group and HS_L group. Red dots and green dots indicate the significantly up-regulated and down-regulated genes, respectively. Blue dots show genes with no significant differences in expression between the LS_L and HS_L group. The horizontal axis represents the log-ratio (gene expression fold change in different samples) and the vertical axis represents the probability for each gene of being differentially expressed. The total DEG number identified by FDR-adjusted P-value < 0.05 is shown

